More than 1.6 billion students have had their schools close temporarily because of the COVID-19 pandemic, over 91% of total enrolled learners (UNESCO, 2020). This has led school systems around the world to attempt to rapidly transition to remote learning. However, it is unclear how prepared students are to respond to this challenge, and whether a lack of availability of electronic devices and internet connections prevents many students from engaging in remote learning. Even when students do have access, there is little available evidence on how much of their time they will devote to learning. Together with my co-authors Igor Asanov, Francisco Flores, Mona Mensmann and Mathis Schulte, we conducted a rapid response phone survey of over 1,500 high school students aged 14 to 18 in Ecuador to find out. Our new working paper summarizes the results, which also looks at technology access and mental well-being of students. This blog post focuses particularly on the issue of measuring time-use and remote learning.
The context
We have an ongoing project that aims to teach high school students, in grades 10, 11 and 12, skills relevant for careers in entrepreneurship and science, using an online course called Showing Life Opportunities. One of the goals is to teach this content at scale, and we are working with approximately 15,000 students, covering more than 80% of students in 126 high schools in three provinces of the country. The course began in September and October 2019, and students accessed the content at school during class time using school computer clusters. The course consists of 26 lessons, and on average students had completed 19 lessons when schools in Ecuador were closed on March 13, 2020, and a national lockdown and quarantine period imposed.
Conducting a rapid response phone survey
We randomly selected a sample of 2,412 students from 88 of the schools to attempt to contact for our phone survey (thanks to Compel and SIEF for funding). Students had provided contact information for themselves (78%) or a parent as part of a self-filled out baseline survey at the start of the course. This gave us phone numbers we could use to try to reach students.
The phone survey averaged 20 minutes in length, and a team of 9 enumerators carried out an average of 60 surveys a day, commencing on March 31, with a two-day break over Easter (April 12/13). We randomly ordered students, so that those contacted later would be similar in profile to those called earlier, enabling us to examine how outcomes vary over time. The survey took place throughout the month of April, interviewing students in weeks 3, 4, 5 and 6 after schools had closed, with final attempts ending May 3. Enumerators tried up to 9 times to reach unresponsive students over multiple days. We successfully interviewed 1,552 students for an overall survey response rate of 64.3%. Only 10 students (0.4%) refused the survey, while the rest had phone numbers that were not answered (11.0%), were non-existent (5.4%), or went straight to voicemail (16.8%).
Because we have the baseline data, we can examine how the characteristics of the students we were able to survey differ from those who weren’t reached. We find no significant differences in response rates by gender, age, language spoken at home, or whether they provided their own phone number. However, students from poorer backgrounds were less likely to answer: 58% of those in the bottom wealth quartile answered the survey, compared to 67% in the top two quartiles.
Measuring time use
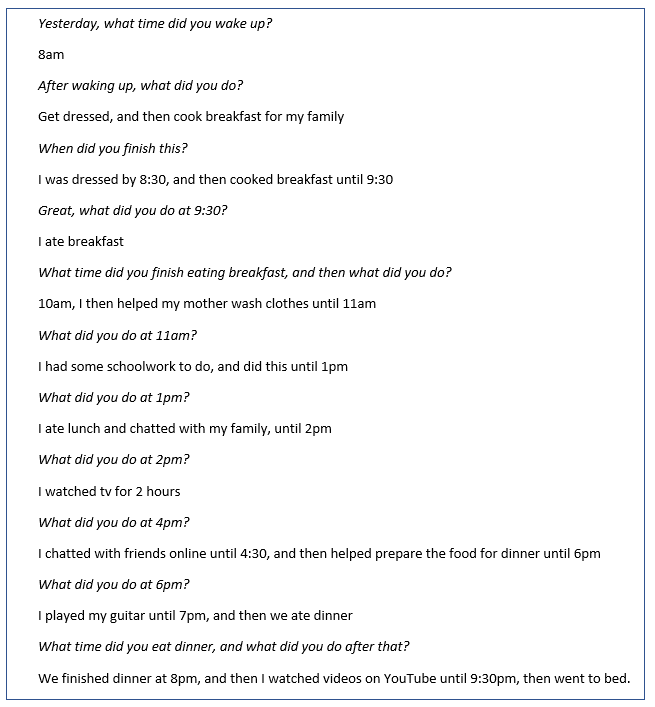
We wanted to understand how these youth were structuring their days, and to reduce the risk of social desirability bias that might come from asking questions directly about the amount of time they were spending learning. We decided to adapt questions from the American Time Use Survey and ask students to go through how they spent the day from 4am the previous day to 4am on the current day. The interviewer asks the student to go through their day, recording in half hour segments what activities the student was doing. For example, a simplified version might look like:
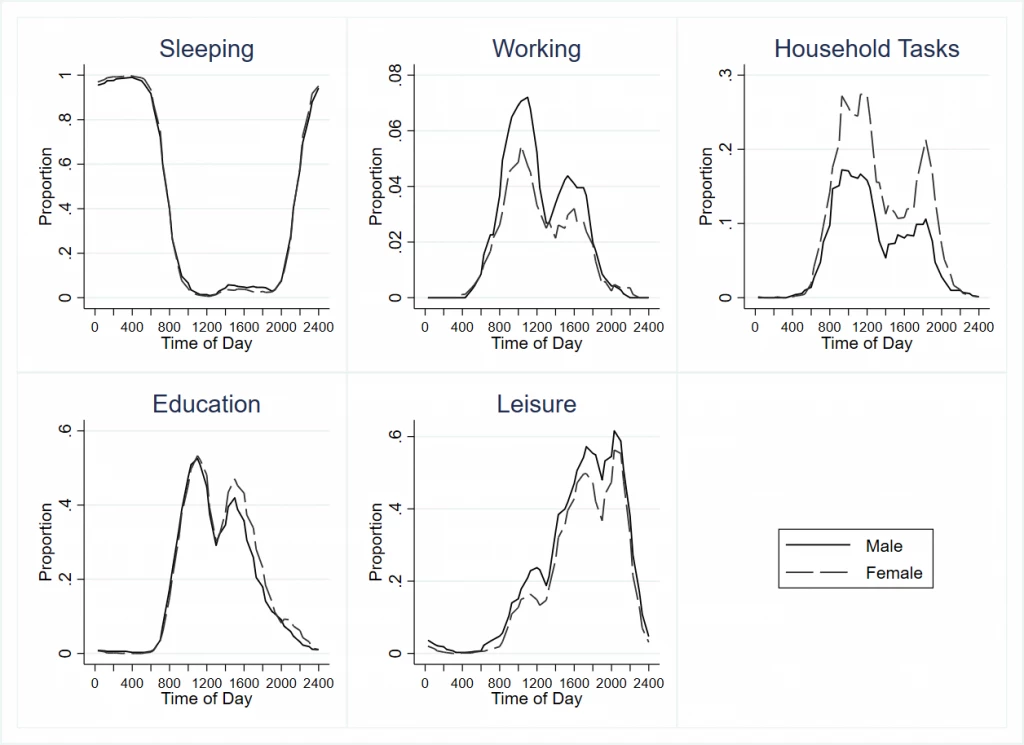
I first piloted this with my 14-year old son to see whether he could answer questions in this format, and then we piloted it with youth in Ecuador to see what the most common response categories were and develop the activity coding. This allows us to get both how much time youth spend on different activities, as well as understand when they do this and what else they do. The figure below shows results broken down by gender, as one example (the paper also breaks this down by wealth quartile and internet access). The y-axis shows the proportion of students engaging in an activity at that time of day, with the range shown differing across activity. We find that 86% of students do some educational activities during the past weekday. Time spent on education peaks at 11 or 11:30 a.m for all groups, with a second peak after lunch at around 3 p.m. One clear gender difference in time usage occurs between work and household tasks – males are more likely to engage in work, and females in household tasks. Males and females are equally likely to be pursuing education in the morning, but in the late afternoon relatively more female students continue schooling as males engage in relatively more leisure activities.
Figure 1: Time Use by Ecuadorian High School Students by Gender and Time of Day
I was really happy with how these time use questions turned out, and they show interesting patterns in how different types of youth are spending their day during the shutdown. Since we are not just putting the students on the spot to ask how much they did schoolwork yesterday, we might be less concerned about students overstating their school effort. But as a check, later in the questionnaire, we also asked directly “How long did you study/do homework yesterday?” in hours and minutes. Figure 2 shows there is a high correlation (0.84) between their direct response and what we aggregate up from the time-use question. This should provide some comfort for those of you asking directly about schooling, although we acknowledge that our direct question comes after students have already been earlier prompted to think carefully about how they spent their day.
Figure 2: Comparison of Direct Report of Time on Education to Time-Use Survey Total
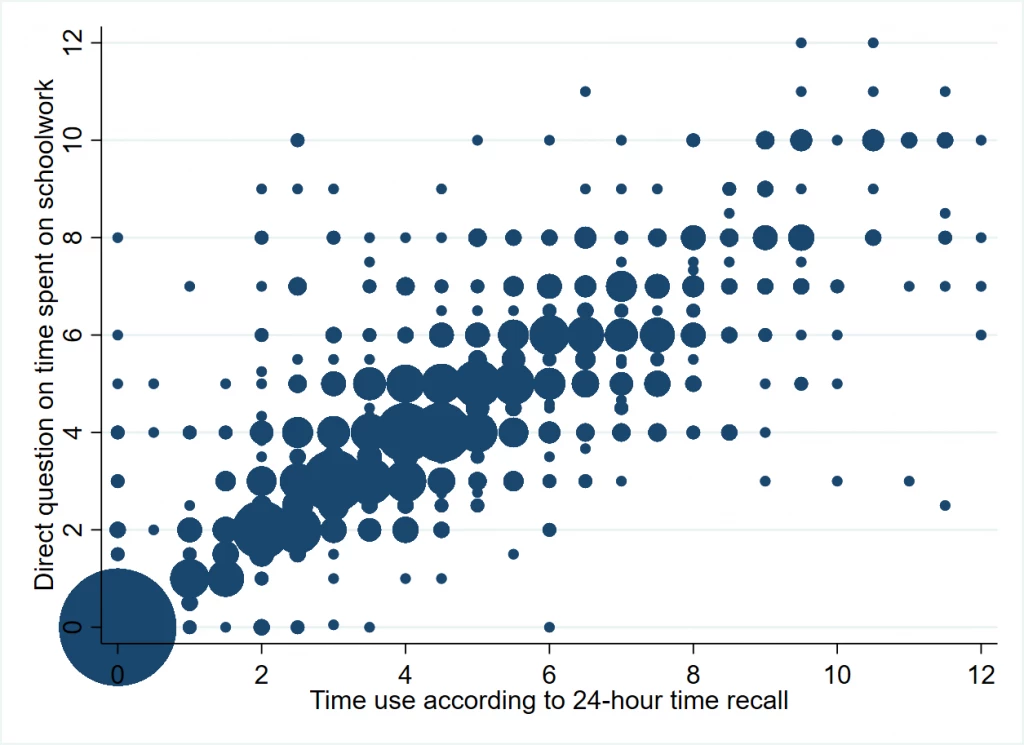
Note: size of bubble is proportional to number of observations with these responses.
What else did we find on time-use?
· The majority of students have both access to online learning technologies, and are doing some online learning: 74 percent have internet access at home, and 59 percent also have a computer or tablet. Three-quarters of students have done some form of online or tele-educative learning in past week, and 86 percent have done some form of schoolwork. The median student spends 4 hours on schoolwork per day.
· Students from more disadvantaged groups – the lowest wealth quartile, indigenous students, students whose mothers have secondary education or lower, and students without internet access - have less access to remote learning technologies, and are less likely to be doing schoolwork. For example, 22 percent of students without internet access did no schoolwork in the past day, compared to 9 percent of those with internet and a computer or tablet.
· Time spent on education doesn’t seem to fall off as schools stay closed for longer periods: since we randomly ordered the students, the groups called in each week are similar. We find the same proportions of students are engaged in education at each hour in the morning for each of the four weeks of April, and although there is some variability in the afternoons, it is not that students progressively spend less time on schooling as time passes.
A few other lessons for doing phone surveys in this context
· Hard to reach places can also be hard to reach by phone: the high mountains and deep forests reduce the strength of telephone signals, which made it more difficult to reach some students, deteriorated the quality of calls, and abruptly cut off communication partway through some calls. Enumerators had to increase the calls, at times taking 4 to 7 times to complete the short interview because of these issues.
· The importance of flexibility in calling times: students who are busy helping in family businesses, with household chores, caring for younger siblings, or working in agricultural fields often have their phones turned off or do not answer during the day. We therefore varied calling times, and also called on weekends to try to make sure we reached such students.
· Monitoring from afar and ensuring quality: while the time use questions above are based on a questionnaire that was already a phone survey, they require more enumerator effort and skill than just asking “how much time did you spend studying”. We looked at the amount of time taken per survey, listened to audio recordings of a subset of responses, and put in place other quality checks. This quickly identified that one of the original enumerators was not carefully recording the time use in the format we wanted, and after feedback and a day to improve failed, we were able to quickly replace this enumerator early into the survey process and redo these time use questions. This highlighted the importance of looking quickly at the data as it came in.
Our full questionnaire is available here for others interested in considering this approach.

Join the Conversation