Last week, Kathleen wrote about how baseline surveys can influence treatment effects. That’s important, but is it really as important (and truly mind-numbing) as what to do about missing values in baseline covariates that are predictive of the outcome? It is the height of applied micro “nerdvana” to worry about getting this stuff right, so let’s discuss a recent paper that formalizes the number of ways to deal with this issue and makes some recommendations…
First, a word or two about missing values for baseline covariates in randomized controlled trials. One might think that this is no longer an issue when we have much more sophisticated survey protocols than, say, a few decades ago. But a quick check with a few colleagues confirms that it remains an issue – even if not as prevalent or severe as it might have been in the past when we used pen and paper surveys. Sometimes, a skip pattern will go wrong, pilot won’t detect it, and then we have part of our sample that did not answer a question. Other times, we’re using administrative data and it’s patchier in some places than others. And so on…
A question via Twitter by Dave Evans and the responses to it reinforces the view that this remains an issue in the minds of authors, referees, and editors alike and that the answer is not clear and there was not one go-to source for making some crucial decisions on how to tackle estimation of average treatment effects when you want to adjust for baseline covariates with missing values…
Well, until now…In an article forthcoming in the Journal of the American Statistical Association (see slides and video on Peng Ding’s homepage here), Zhao and Ding provide theoretical support to an old, simple-to implement missingness-indicator method (mim), propose a variant that can improve efficiency when sample sizes are large enough, and compare these methods to alternatives to assess their consistency and efficiency in a design-based framework for RCTs.
Before I get to their setup, findings from simulations, and recommendations, let me also repeat here something about covariate adjustments in RCTs. As the authors describe and heavily rely on, Lin (2013) improved on Fisher (1935) by showing “the coefficient of the treatment from the ordinary least squares fit of the outcome on the treatment, centered covariates, and their interactions is a consistent and asymptotically efficient estimator for the average treatment effect, and moreover, the associated Eicker-Huber-White robust standard error is a convenient approximation to the true standard error.” This implies that instead of running this regression when estimating ITT/ATE in your RCT:
you should really be running:
I repeat this because, even though this has been known for more than a decade now, and the fact that the use of such specifications has been reinforced with the recent developments in the difference-in-differences literature, I still see many papers that use the former. With the hope that repetition slowly changes practice in the field, I repeat this point here…
Methods discussed by Zhao and Ding (2022+)
The paper describes the methods by which one might tackle missing values in baseline covariates that they want to use in covariate-adjusted regressions to estimate the average treatment effect (ATE). The main assumption is that these missing values are not affected by the random treatment assignment. In other words, the missingness indicator (which can be a vector) 
Table 1 in the paper summarizes the methods the authors consider: complete case analysis discards all observations for which at least one covariate is missing. This introduces issues of external validity, i.e., whether the remaining sample that is being used is representative of the target population. Complete covariate analysis omits any covariates that are not completely observed for all individuals (units). Not a fan of this one, either, as it would cause you to discard a covariate that is very prognostic of the outcome because it is missing for some units. The third option is the single imputation method (imp), which imputes all missing values by some prespecified value that may depend on the observed data. Common choices are imputing zero or the mean (perhaps by treatment status) in the sample. The authors note that while it seems restrictive to enforce an identical imputation value to all missing values of the same covariate, it is sufficient in RCTs and cite papers that demonstrate the insensitivity of the standard analyses to imputation methods in randomized experiments.[1] The fourth method suggested is the missingness-indicator method, or mim, which simply adds missingness indicators to imp. In other words, you simply treat the missingness indicator as another fully observed baseline covariate and include it (centered and interacted with treatment) in the regression analysis:

to obtain the Lin (2013) estimator for the ATE from the coefficient on 

Up until here, everything is known and not uncommon, but it is nice to have these all described for the RCT case under a design-based framework. The authors then suggest a fifth method, while not new, much less commonly used. Named the missingness-pattern method (mp), this essentially is post-stratification a la Miratrix et al. (2013): you estimate the ATE as a weighted average of all the treatment effects estimated within each pattern of missingness. An example might help. Suppose that you have two covariates for an early childhood development trial: a lagged baseline assessment and age in months. Each cell in the 2x2 matrix of assessment or age missing: yes/no is a stratum. You can estimate the treatment effect using non-missing values of the covariates in each stratum (and unadjusted for the cell where both are missing) and take a weighted average of these effects. This is clever and can be seen as a hybrid of the complete-case and complete-covariate analyses: you’re making use of all the data. It is also not surprising that a regression specification that adjusts for imputed values (imp), missingness indicators (mim), and all their interactions recovers the coefficient estimate and its standard error for this method (mp). The downfall of mp is its need for large samples: for many of the RCTs I know, it’s hard to see the researchers being able to employ this method in practice, due to small sizes of strata. One could collapse smaller-sized missingness patterns, but perhaps these are for future work…
In section 4, the authors establish a hierarchy of these methods. The complete-case analysis is inconsistent because the sample may not be representative of the population. The other four methods are all consistent and mp is most efficient, followed by mim, imp, and complete-covariate analysis. The mp method effectively uses a fully interacted OLS with covariates including 
 ), and all their interactions, and ensures asymptotic efficiency at the cost of being the most demanding on pattern-specific sample sizes. The mim method simplifies the specification by excluding interactions between {)}. The imp simplifies the specification by discarding all terms involving the missingness indicators. The complete-covariate analysis simplifies the specification by further discarding all dimensions in
Before we discuss simulation results and recommendations, a quick note. Many of us have been using a combination of imp and mim for a good while now. I relied heavily on the Standard Operating Procedures at Don Green’s Lab at Columbia in my work for the past 7-8 years. The theory presented in this paper and the following findings simply provide support for that decision. In addition, some of us running large trials may be lucky enough to benefit from the additional efficiency gains from employing the mp method…
Simulations and recommendations
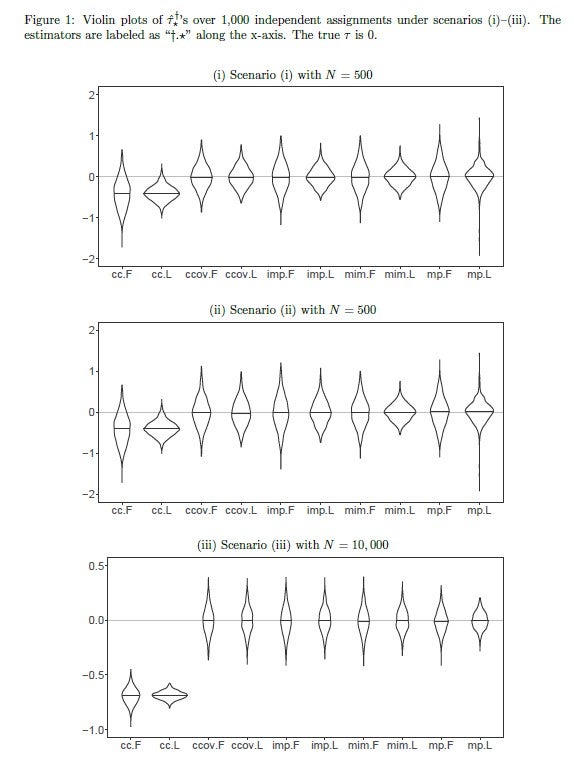
Figure 1 in the paper presents simulations in the form of violin plots for ATE estimates for three different scenarios: in the first scenario, N=500, we see that the complete-case analysis is biased while the rest are consistent. The fully-interacted Lin estimators (.L) are more efficient than the additive Fisher ones (.F). Efficiency within estimators is not substantially different across methods, although note the long tails on the mp estimators due to the relatively small sample sizes under missingness patterns. The second scenario generates a relationship between outcomes and missingness indicators, meaning that they are strongly prognostic of the outcome. When this happens, the improvement in efficiency is apparent when moving from imp to mim. In the third scenario, potential outcomes are affected by more complex interactions of missingness indicators and patterns. With the sample size increased to 10,000, the improvement in efficiency is obvious, moving from mim to mp. In section 6, the authors also present a real-life application of these methods using replication data from Duflo et al. (2011) and find similar results. Importantly, of the nine missingness patterns (emanating from seven covariates with missing values out of the 27 that were used in the study), four had less than five observations, meaning that the mp method was not possible to include in the analysis.
In Section 7, the authors discuss other regression specifications, cluster randomization, and stratified randomization (as opposed to complete randomization assumed throughout the paper). The extensions do not seem demanding. Interestingly, if the missingness patterns are dependent on treatment status, then only the complete-covariate analysis remains consistent. Given that it had the largest asymptotic variance among all consistent estimators under missingness being orthogonal to treatment assignment, its consistency in the absence of this condition “…thus gives an analog of the bias-variance trade-off in terms of the asymptotic biases and variances.”
There you have it: if you want to use simple imputation with missingness indicators in OLS analysis of your RCT, go for it. You can cite this paper if reviewers object. If you are lucky enough to have a large trial, you might even gain more efficiency by trying to adopt the missingness-pattern method.
[Many thanks go to Winston Lin, who always has time to respond to my stats questions. This post has benefited from a number of short exchanges with Winston over text messages.]
[1] The paper is silent on the issue of multiple imputations, which was a method that was suggested frequently in response to Dave Evans’ tweet mentioned above. My suspicion is that this is because that question was more general about imputing missing values, whereas the subject of this paper is causal inference in randomized experiments: multiple imputation might be more relevant when estimating a population mean, but this is just informed speculation. The authors simply have a vague reference in the intro section of the paper to this issue – without explicitly mentioning multiple imputation: “Although some existing methods for missing covariates are likely to further improve efficiency, they rely on additional modeling assumptions on the outcome model or the missingness mechanism (Rubin 1987; Little 1992; Ibrahim et al. 2005; Little and Rubin 2019). Due to the unverifiable additional assumptions, these more sophisticated methods do not strictly dominate the simpler unadjusted estimator and complete covariate analysis in randomized experiments. Then a natural question arises: should we adjust for the missing covariates or not?”

Join the Conversation