Last week I taught a week-long summer school course on practical issues in designing and analyzing field experiments at NOVAFRICA. One of the issues that came up and that had several questions about how and when to use this was using a waitlist as part of your experimental design. This is something I had recommended in a 2015 blog post, but I thought it revisiting and discussing some of the additional questions that came up.
The basic idea: randomize to three groups - treatment, control, and waitlist
The recommendation: randomize individuals into a treatment group, a control group, and a, typically much smaller, waitlist group. For example, in a large scale vocational training program in Turkey, training providers were asked to select a list of potential trainees that was at least 2.2 times capacity, and then if the course had capacity for 50 trainees and 120 were deemed eligible, we would assign 50 to treatment, 50 to control, and 20 to waitlist.
Why do this? This is designed for programs with the following characteristics:
· You have a scarce resource (number of training slots, number of grants that can be given out, number of seats at some event) where demand exceeds supply, and where you want to try to ensure every slot is used. For example, training providers are often paid per person actually trained, so if you assign them 50 trainees and only 35 show up, they will be demanding you give them some more names they can call to fill the empty slots. Or a government grant agency will want to disburse all the money it has available, but those selected may have to go through due diligence processes, attend various events, and submit a lot of paperwork to actually receive the money, with not all selected getting the money. For example, in work with matching grants, we give examples of a program in which only 51 of 165 approved firms actually took up the grants, and another where only 80 of 150 firms selected took up the grants.
· As a result of the above, there is the possibility of units from the control group being offered the treatment as a replacement for those who do not take it up in the treatment group.
· The program is decentralized, or run by another agency, or other circumstances arise in which the research does not have complete and timely control over replacements. If you are running a program completely yourself, or have extremely good technical expertise in the implementing partner, you could consider just re-randomizing units from the control group one at a time to the treatment group as needed. But often there is a need to quickly find additional people to fill the missing slots (e.g. on the night before training, a provider may find themselves with 10 slots they need to fill before the following morning, and then will call to find whoever is available). I have also found myself on a long plane flight, only to land and find they needed an additional few people to be treated and so they choose some of the control themselves to treat while I was in the air.
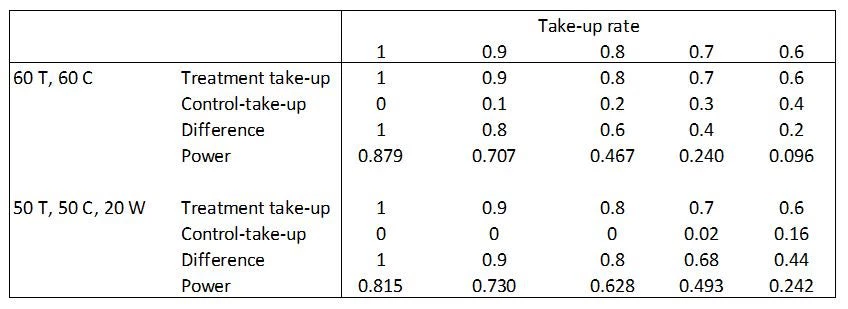
How does the waitlist help? The waitlist makes it easier for the partner to ensure they fill their capacity, while still maximizing the difference in take-up rates between the treatment and control groups. You can then exclude the waitlist from your experiment (they become a sample that the implementor can use however they like). Here is a little toy example to show how this can improve power in practice when you have incomplete take-up. Suppose income in the absence of treatment is 100, with a standard deviation of 35, and the treatment effect is a constant 20 for those who take-up treatment. Then let’s compare two ways of using a sample of 120 individuals. The standard approach would be to allocate 60 to treatment and 60 to control. Then with 100% take-up, power is 87.9%. However, if take-up is incomplete, then we assume that people from the control group get asked if they would like to participate until the empty seats are filled. With 90% take-up, this results in only a 80% treatment-control difference in take-up rates, since 54 seats are filled by those assigned to treatment, and 6 seats by those assigned to control, reducing power to 70.7%. The typical business training program has around 65-70% take-up. We see with 70% take-up, the treatment-control difference in take-up rates is only 40%, and power has dropped to 24%. This is effectively what happened in a planned RCT of financial literacy in Uganda I worked on.
In contrast, let’s see what happens when we use a waitlist that we throwaway when it comes to experimental analysis. Throwing away these 20 observations obviously hurts us when take-up is 100%, with power now 81.5%. But even with 90% take-up, we see power is now higher than in the case without a waitlist. We fill our 50 seats with 45 from the treatment group, and 5 from the waitlist, so the treatment-control difference in take-up is now 90% compared to 80% without a waitlist, and power is 73% versus 71% without the waitlist. The power advantages are even clearer with 70% take-up, since we now fill 35 of the 50 seats from our treatment group, fill 14 of them from the 20 in the waitlist, and then only have 1 left to fill by going into the control group. The treatment-control difference in take-up is now 68%, compared to 40% with no waitlist, and power is more than twice as high.
Table: illustration of how adding a waitlist can boost power
Note here the crucial assumption is that the slots have to get filled one way or another. If you are running an experiment in which you can completely restrict the control group from ever taking part in the treatment, then the treatment-control difference in take-up will be the same as the treatment group take-up rate, and there is no need for you to have a waitlist – and if you offer a program that only 70% participate in, then you just spend 70% of what you had planned.
Questions and Issues
1. If I don’t use my waitlist at all, or if all of it is used, can I use it in my experimental analysis? Yes, the waitlist is effectively an additional stratum. If I had 100% take-up, then my waitlist is just effectively another stratum of my control group, and so I could then analyze this as an experiment with 50 assigned to treatment and 70 assigned to control. That would boost power in the first column up to 0.870. Conversely, by time I get to 70% take-up, all my waitlist is getting offered treatment, and so I could analyze this as having 70 assigned to treatment and 50 assigned to control. This would boost power further to 0.555 in the 70% take-up column for the waitlist group. But if I end up with partial usage only of my waitlist, and the waitlist are not called in random order but selected from based on convenience, then including the waitlist as either a treatment group with lower take-up than the rest of the treatment group, or as a control group with higher take-up than the rest of the control could reduce power.
2. What are some downsides of using a waitlist?
a. The potential for moral hazard: the above analysis assumes that the existence of a waitlist does not affect take-up of those assigned to the treatment group. But if the implementing organization knows they have this waitlist they can turn to, they may try less hard to encourage those in the take-up group to actually take part in the treatment. So you may want to just have the waitlist known to e.g. someone senior in the partner organization who can use for emergencies, but not to the people in charge of getting people to show up.
b. Interpretation of average treatment effects if take-up varies by site or class and I end up reassigning waitlists to treatment or control in some: Suppose in city A there is 100% take-up, and so I reassign my waitlist as a control group; and in city B, there is lower take-up, and I end up using all my waitlist and reassigning it as a treatment group. Then the odds of getting selected for treatment are different for the two cities, and so when I look at the average effect of being offered treatment, I will be putting more weight on the city that had lower take-up (since more individuals got assigned to treatment there). You would then need to think about reweighting the estimates or be very clear in which average treatment effect you are interested in.
3. So how big should my waitlist be? This will depend on what your anticipated take-up rate is going to be, and you can do power calculations like the above to get some sense of what makes sense. But given the concerns about moral hazard and about potential reductions in power from throwing away sample if you don’t reassign the waitlist, my rule-of-thumb would be to keep this waitlist pretty small in most cases, at about 10-12% (like my 45% T, 45% C, 10% waitlist example).
Addendum: John Loeser helpfully reminded me of this paper, which describes some of the issues that arise when re-allocating control to treatment until all slots are filled, and proposes a different estimator to use in those cases.

Join the Conversation