Often there are many steps or stages between the starting point of some intervention and its ultimate goal, and at each step, people can drop out. The result can be extremely low power to measure impacts on this end outcome, even though we might be able to detect impacts on the intermediate steps. This post illustrates this point, with the goal of making clear the importance of trying to measure intermediate outcomes, and concludes with suggestions of ways to partially overcome this problem.
An illustrative example: an investment readiness program
In an ongoing impact evaluation, I am working with Ana Cusolito and Ernest Dautovic on an intervention designed to help innovative firms in the Western Balkans get to a point where they can receive outside equity investment. That is, starting with a sample of firms, our ultimate outcome is getting them equity investment (and you can extend this further to say we would then care how this equity investment affects their growth if you want to add additional steps). However note I am using made-up numbers here, since we are still waiting for all results.
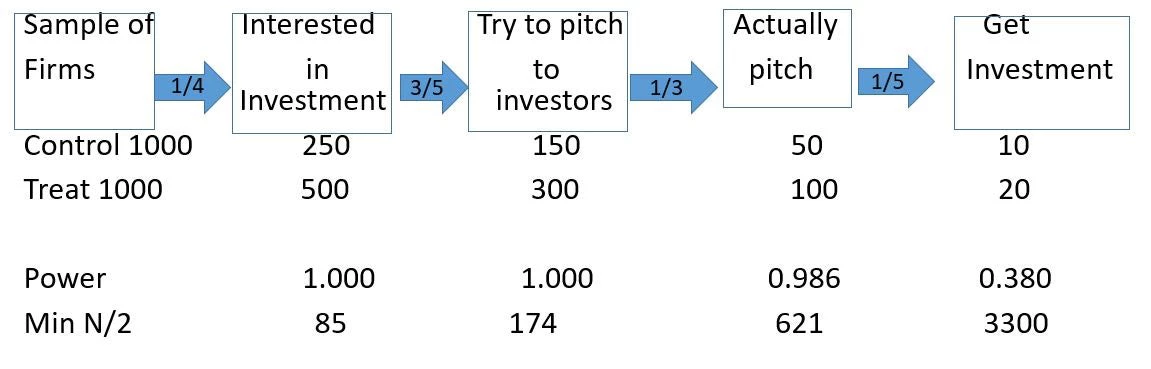
Figure 1 shows a possible “funnel of attribution” (which is a better description than causal chain here in making clear the loss at each stage). If we start with a sample of firms, perhaps one-quarter of them in the control group might be interested in receiving outside investment. Of those interested, perhaps 60% try to pitch to investors, of which one-third actually get to pitch, and, if we are really lucky, maybe 20 percent of firms that do pitches actually get equity investment. As a result, if we start with 1000 firms in a control group, maybe 10 will end up getting equity.
Figure 1: The Funnel of Attribution and Challenge of Measuring Impact
Now we come in with our intervention – a training program to get firms more interested and ready for getting outside equity investment. Suppose this treatment is really powerful in getting more firms interested in seeking equity, so that it doubles the number getting to the first step, and then they proceed at these same failure rates through each step – so doubling the number of firms at each stage. That is, we get 500 instead of 250 interested firms, 300 interested in making a pitch vs 150 in the control, through to 20 getting equity finance instead of 10.
Great right? In this scenario our treatment doubled the number of firms getting equity. However, the bottom of the table shows the problem for power. If we started with 1000 firms in each group, we would have almost 100% power to detect impacts on the first three stages in this funnel, but only 38% power to detect the impact on the ultimate outcome we care about. Conversely, we would only need 85 firms in each group to have 90% power to detect the impact on the first stage in this funnel, versus 3,300 in each group to have this power to detect the impacts on equity investment.
Implications:
- Failure to see impacts on your ultimate outcome need not mean the program has no effect, just that the funnel of attribution is long and narrows.
- It is therefore key to try and measure as many stages along this funnel as possible, so we can at least see if it is having these intermediate effects – another reason to “open the black box”.
- Things will look a bit better if the treatment also improves the likelihood of getting from one stage to another (the fractions in the arrows) – so it can be useful to use your data to see whether this is happening by examining the ratios getting through each stage.
- Massive samples are going to be needed to start at the top of the funnel and expect to see significant impacts at the end – which may be impossible in these types of settings due to both a shortage of firms and the cost of implementing these programs.
- Think about interventions that start further along within the funnel. In this toy example, if we were able to start with a sample of firms that were already at the point of getting ready to pitch to investors, and improve their investment readiness then, we would have a lot more power to measure impacts on equity than if we had the same sample size at the start of the funnel.
- Rely on other evidence to help fill out the bits of the funnel that your experiment doesn’t provide enough power on – e.g. if we had mapped out the above stages and knew the ratios, we could multiply the treatment effect on “interested in investment” by the ratios in each subsequent stage to get an estimate of the likely impact on the ultimate outcome.
Stay tuned to see what we actually find – the bad news being that we only started with 346 firms, and it took working in five countries to put a sample that large together!

Join the Conversation