Some years ago, a government I was working with really wanted to increase the data they had on their own education system. They didn’t have great data on student attendance or teacher attendance, much less on tardiness or instruction time. They designed an information management system with swipe cards for every student and teacher to use going in and out of classrooms, all of which would feed wirelessly into the district office, allowing real-time interventions to improve education. It sounded amazing! And it fell apart before it ever began. Connectivity and many other problems reared their ugly heads, and ultimately most of the program was jettisoned. Another time, I worked with a government to use smartphone cameras to improve school monitoring by inspectors (an update of the
Duflo et al. experiment). Myriad problems with the software and the hardware led to very little implementation, with (unsurprisingly) little impact on meaningful outcomes.
Merge anecdotes like those (datum + datum = data?) with meta-analytic evidence on the massive variation in results from technology-related interventions to date: Exhibit A is McEwan’s figure (below) showing results of technology-related education intervention in low- and middle-income countries. Exhibit B is Bulman and Fairlie’s 2016 review of technology and education, which reports “mixed evidence with a pattern of null results” (although they’re slightly more bullish on developing countries). It’s easy to be a technoskeptic, or at least a technorealist.
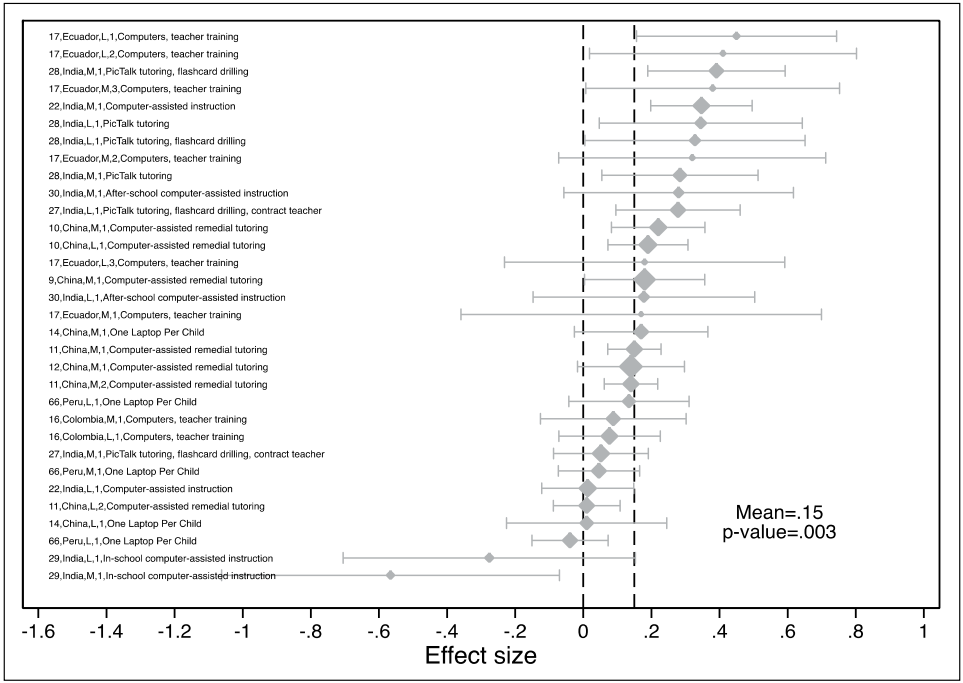
Source: McEwan (2015)
A strikingly promising result for computer-assisted learning
Into this mix, throw in a computer-assisted learning intervention that could increase math scores by 0.59 standard deviations and language scores by 0.36 standard deviations in 90 days ( Muralidharan, Singh, & Ganimian 2017). For context, the 0.59 effect size is 25 percent larger than the largest effect size in the McEwan study (above), and four times higher than the average. And this isn’t just a really big effect size on the same kind of intervention (i.e., red flag on plausibility): It’s a different kind of computer-assisted learning, adapting as it goes to student learning levels. So it feeds into the already promising literature on adapting instruction to students’ actual learning levels (“ Teaching at the right level”).
The intervention
The Mindspark computer-assisted learning software “is interactive and includes continuous student assessment alongside instructional games, videos, and activities from which students learn through explanations and feedback.” Here are four main features:
The experiment
About 600 students were recruited from public middle schools in low-income neighborhoods in Delhi. They were separated into treatment and control by lottery. Treatment youth received a voucher to attend the Mindspark center for free for the course of the 4.5 month evaluation. Average attendance among lottery winners was 58 percent (about 50 days of attendance).
The results
After 90 days, lottery winners scored 0.36 standard deviations higher than lottery losers in math, and 0.22 standard deviations higher in Hindi (adjusting for baseline difference, as in the figure below).
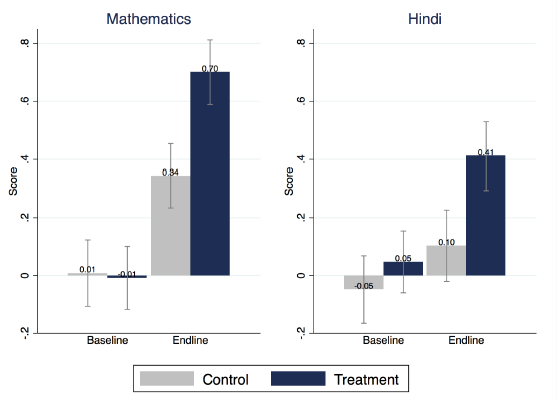
While the absolute gains were equal across gender and poverty level and baseline test scores, the relative gains for students who started with low performance are much higher, as you can see below.

This brings me to one of the most striking "side findings" of the paper: In their regular schooling, the lowest performers at baseline are learning next to nothing. Below are the gains just among the control group (so, no Mindspark).

But wait, I thought the effects were even bigger!
The above results are for lottery winners (a.k.a. intent-to-treat). The authors then examine the relationship between test scores and actual attendance at the Mindspark centers, instrumenting for attendance with random assignment to a voucher (a.k.a. treatment-on-the-treated). Those estimates suggest that 90 days of attendance (the equivalent of half a school year at 80 percent attendance) would deliver 0.59 standard deviations of learning in math and 0.37 in Hindi.
Frankly, even the intent-to-treat effects are big: “The ITT effects on math were close to a full grade-level over just 4.5 months (even with only 58% attendance).”
Given that – and the fact that the fixed costs of software development are in the past – the authors do some cost-effectiveness analysis and argue that Mindspark is cheaper than “default public spending” on education.
How do we know it was the software?
After all, half the time at the center was group-based instruction. While it’s impossible to separate the effects experimentally here, the authors marshal a few arguments: First, where group-based instruction interventions have had any impacts in the past, it has tended to focus on making groups of students more homogeneous, either by focusing only on students in need of remedial work ( here or here) or by re-grouping classes ( here). Second, there is evidence that in fact the instruction received via the computer was highly individualized, something difficult for even the most motivated teacher to attain in a highly heterogeneous class. Lastly, the implementing agency argues that most of the time with the instructor was focused on homework completion and preparation for official school exams.
A caution
“Our results speak more broadly to the potential for new technologies to enable low-income countries to leapfrog constraints to development.” (Pssst! India isn’t a low-income country!) Even as I write about these very promising results, I have ugly visions in my head of rooms filled with computers but devoid of students. The computers have broken and there’s no budget to fix them, and the power supply was too spotty to make them consistently useful in the first place.
These results are exciting and I hope that this intervention is tested elsewhere. But in low-income, low-infrastructure environments, be realistic about what computing infrastructure is plausible. (And remember Trucano’s four cautions about education technology.)
Lessons for education research
That’s the end of the results, but the authors were kind enough to share a few thoughts on lessons for educational research, which I’ve abridged and annotated below.
Merge anecdotes like those (datum + datum = data?) with meta-analytic evidence on the massive variation in results from technology-related interventions to date: Exhibit A is McEwan’s figure (below) showing results of technology-related education intervention in low- and middle-income countries. Exhibit B is Bulman and Fairlie’s 2016 review of technology and education, which reports “mixed evidence with a pattern of null results” (although they’re slightly more bullish on developing countries). It’s easy to be a technoskeptic, or at least a technorealist.
Source: McEwan (2015)
A strikingly promising result for computer-assisted learning
Into this mix, throw in a computer-assisted learning intervention that could increase math scores by 0.59 standard deviations and language scores by 0.36 standard deviations in 90 days ( Muralidharan, Singh, & Ganimian 2017). For context, the 0.59 effect size is 25 percent larger than the largest effect size in the McEwan study (above), and four times higher than the average. And this isn’t just a really big effect size on the same kind of intervention (i.e., red flag on plausibility): It’s a different kind of computer-assisted learning, adapting as it goes to student learning levels. So it feeds into the already promising literature on adapting instruction to students’ actual learning levels (“ Teaching at the right level”).
The intervention
The Mindspark computer-assisted learning software “is interactive and includes continuous student assessment alongside instructional games, videos, and activities from which students learn through explanations and feedback.” Here are four main features:
- It includes extensive, high-quality instruction materials: more than 45,000 test questions, developed over several years of iterations.
- It is adaptive in the level of instruction: The activities that students do are based both on an initial diagnostic and on student performance in each subsequent activity. Mindspark does “Teaching at the right level ” technologically.
- It is adaptive in the approach: Even two students at the same level may be stuck for different reasons. Mindspark examines patterns of error to target “differentiated remedial instruction.” So if a student makes a mistake on which decimal is bigger (3.27 or 3.3), it may be due to “whole number thinking” (27 is bigger than 3) whereas if they make the same mistake with 3.27 or 3.18, it’s probably “reverse order thinking” (comparing 81 to 72 because the “hundredth place” should be bigger than the “tenth place”). Mindspark then targets activities based on the likely reason for the mistake. A good teacher may catch this if most of the class is making the mistake, but it’s much less likely if only a few students are making it. Those students get left behind.
- The interface requires constant engagement: Rather than lots of time on videos (which lets kids get distracted), some videos are complemented with steps that require students to continue to engage.
The experiment
About 600 students were recruited from public middle schools in low-income neighborhoods in Delhi. They were separated into treatment and control by lottery. Treatment youth received a voucher to attend the Mindspark center for free for the course of the 4.5 month evaluation. Average attendance among lottery winners was 58 percent (about 50 days of attendance).
The results
After 90 days, lottery winners scored 0.36 standard deviations higher than lottery losers in math, and 0.22 standard deviations higher in Hindi (adjusting for baseline difference, as in the figure below).
While the absolute gains were equal across gender and poverty level and baseline test scores, the relative gains for students who started with low performance are much higher, as you can see below.
This brings me to one of the most striking "side findings" of the paper: In their regular schooling, the lowest performers at baseline are learning next to nothing. Below are the gains just among the control group (so, no Mindspark).
But wait, I thought the effects were even bigger!
The above results are for lottery winners (a.k.a. intent-to-treat). The authors then examine the relationship between test scores and actual attendance at the Mindspark centers, instrumenting for attendance with random assignment to a voucher (a.k.a. treatment-on-the-treated). Those estimates suggest that 90 days of attendance (the equivalent of half a school year at 80 percent attendance) would deliver 0.59 standard deviations of learning in math and 0.37 in Hindi.
Frankly, even the intent-to-treat effects are big: “The ITT effects on math were close to a full grade-level over just 4.5 months (even with only 58% attendance).”
Given that – and the fact that the fixed costs of software development are in the past – the authors do some cost-effectiveness analysis and argue that Mindspark is cheaper than “default public spending” on education.
How do we know it was the software?
After all, half the time at the center was group-based instruction. While it’s impossible to separate the effects experimentally here, the authors marshal a few arguments: First, where group-based instruction interventions have had any impacts in the past, it has tended to focus on making groups of students more homogeneous, either by focusing only on students in need of remedial work ( here or here) or by re-grouping classes ( here). Second, there is evidence that in fact the instruction received via the computer was highly individualized, something difficult for even the most motivated teacher to attain in a highly heterogeneous class. Lastly, the implementing agency argues that most of the time with the instructor was focused on homework completion and preparation for official school exams.
A caution
“Our results speak more broadly to the potential for new technologies to enable low-income countries to leapfrog constraints to development.” (Pssst! India isn’t a low-income country!) Even as I write about these very promising results, I have ugly visions in my head of rooms filled with computers but devoid of students. The computers have broken and there’s no budget to fix them, and the power supply was too spotty to make them consistently useful in the first place.
These results are exciting and I hope that this intervention is tested elsewhere. But in low-income, low-infrastructure environments, be realistic about what computing infrastructure is plausible. (And remember Trucano’s four cautions about education technology.)
Lessons for education research
That’s the end of the results, but the authors were kind enough to share a few thoughts on lessons for educational research, which I’ve abridged and annotated below.
- Construct tests that cover the range of student ability, not just grade level. “We'd have pretty misleading results if we just used grade appropriate tests because most of the learning gains were at lower grade levels.” I found this once in a Sierra Leone evaluation, when commissioning a test for fourth-graders. Our test expert suggested we include a text from the first-grade textbook. Even that turned to be too hard for most students.
- Don’t limit yourself to average learning levels in the classroom. To better understanding learning and design more effective interventions, it’s crucial to characterize the distribution of learning in the classroom.
- Be clear when “the intervention is a composite one and that the interpretation of the results should be as a composite intervention, but [use] descriptive and non-experimental data to help clarify what we think are the key mechanisms of impact.”
- “The baseline and endline tests are linked to a common metric using Item Response Theory.” That makes is possible to “express treatment effects as a fraction/multiple of the business as usual test score gains in the control group” and to “characterize the nature of this business as usual progress at different initial learning levels.” (Economists, if you have no idea what they’re talking about, that’s confirming evidence that you need to talk with a test expert.)
- Much of the literature arguing against ability grouping is focused on rich countries, which don’t face this kind of heterogeneity in the classroom: Muralidharan et al. observe “students enrolled in the same grade typically spanning five to six grade levels in their readiness.”
- The authors’ three-part take on what we know about technology and education to date
- “Hardware-focused interventions that provide computers at home or at school seem to have no positive impact on learning outcomes.”
- “Pedagogy-focused CAL programs that allow students to review grade-appropriate content at their own pace do better, but the gains are modest and range from 0.1 [standard deviations] to 0.2 [SDs].”
- “Interventions that use technology to also personalize instruction seem to deliver substantial gains.”
- The centers target low-income households, but donors require a fee under the belief that “cost-sharing is necessary to avoid wasting subsidies on those who will not value or use the product.” We have evidence in health that this is not the case.

Join the Conversation