The Central Statistical Agency (CSA) of Ethiopia, in collaboration with the World Bank’s Living Standards Measurement Study (LSMS) team, have released the results from the fourth wave (2018–19) of the Ethiopia Socioeconomic Survey (ESS). The ESS 2018/19 data and documentation, including the main Survey Report and the Financial Inclusion Report, are now available on the World Bank’s Microdata Library.
The ESS is designed to generate a comprehensive analysis of the income, well-being, and socioeconomic characteristics of households in Ethiopia. The survey covers a nationally representative sample of over 6,700 households living in both rural and urban areas. The sample is also regionally representative. Previous rounds of the survey were implemented in 2011–12, 2013–14, and 2015–16.
Here are some key findings from the latest round:
Agriculture
- On average, rural households own 1 hectare of land, but while on average male-headed households own 1.12 ha, female-headed households own 0.6 ha. fields.
- Fertilizer is applied in about 66% of maize, wheat, barley, and teff fields but only 35% of sorghum. Except for maize and wheat, improved seed usage is very low.
- Some 62%–77% of major cereal crop production is for consumption; sales account for 9%–25%. Farm households tend to sell teff and other higher-value crops and consume lower-value cereal crops like sorghum.
Education and Health
- School attendance: about 35% of boys and girls aged 7–18 years are not in school. Primary school enrollment: about 60% of males and 59% of females. Secondary school enrollment: about 5% of males and 7% of females.
- Self-reported illness for the 4 weeks preceding the survey is 4% for males and 5% for females.
- Disability — difficulty hearing, seeing, walking, or climbing, remembering or concentrating, performing self-care such as washing, dressing and feeding, and communicating or understanding – is higher for the those aged 51 and above, with females having more self-reported disabilities than males.
- Healthcare utilization for treatment or checkup in the preceding 4 weeks is about 9% for males and 11% for females.
Water and Sanitation
- Nationally, over 74% of households report having access to improved water during both rainy and dry seasons.
- About 69% of households do not have an improved toilet facility and 59% do not have a hand-washing facility.
Food Security and Shocks
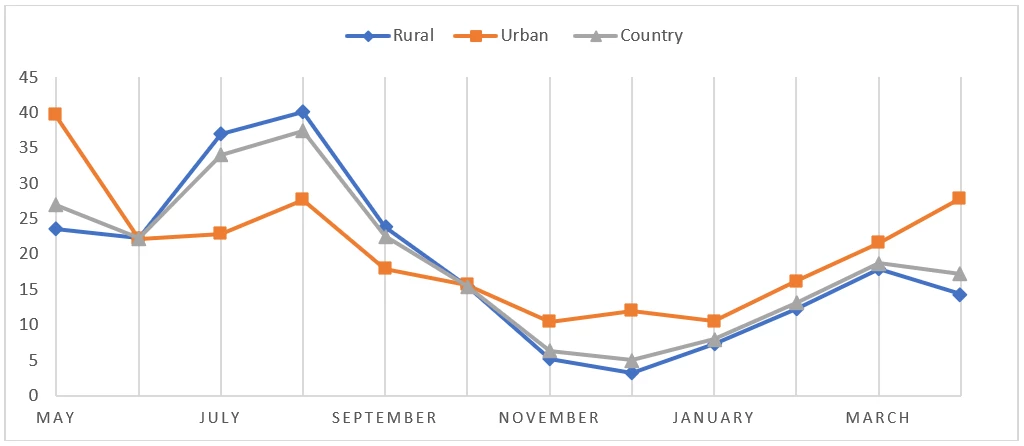
- Food is scarcer in the major planting season, April to September. Rural households tend to be the most affected by seasonal food shortages (Figure 2).
- Major shocks that affect households negatively are, in order of importance, illness of a household member, unexpected rises in food prices, drought, and higher prices of inputs. To cope with major shocks, households mainly deplete savings or sell livestock.
Figure 1: Percent of Households Reported Food Shortages by Month, Ethiopia 2019
Non-Farm Enterprises
- Nationally, at least 23% of households have at least one nonfarm enterprise (NFE).
- The three main barriers to establishing NFEs are lack of financial services (33%) and access to transportation (18%) and markets (14%).
Financial Inclusion
- In 2018/19, about 30% of adults (18 years and older) had an account at a formal financial institution, up from 21.8% in 2015/16 – a 9 percentage points increase in individual account ownership over 4 years. At the household level (meaning that at least one adult in the household has an account), account ownership is 45.9%.
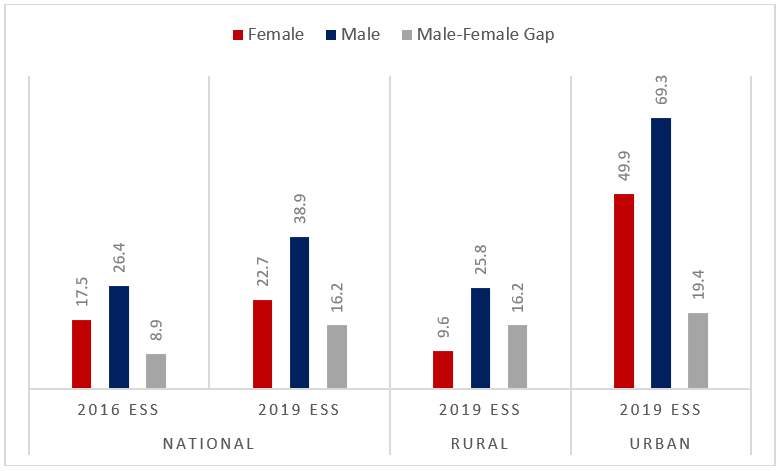
- Substantial and widening differences in account ownership (Figure 2) - Nationally, about 39% of Ethiopian men are financially included, but only about 23% of women. While female account ownership went up from 17.5% in 2015/16 to 22.7% in 2018/19, the gender gap nevertheless widened from 8.9 to 16.2 percentage points.
Figure 2: Account ownership at a formal financial institution by gender, Percent.
The ESS is a collaborative project of the Central Statistics Agency, Ethiopia (CSA) and the World Bank. It is generously supported by the Bill and Melinda Gates Foundation through the Living Standards Measurement Study–Integrated Surveys on Agriculture (LSMS-ISA) project.
Data from all four waves has been made freely available to encourage policy makers, researchers and development partners to monitor living standards and formulate policies.
To access the dataset, and documentation on the survey process and results, visit the Microdata Catalog.


Join the Conversation