
In 2010, Ghana made international headlines when its nominal GDP grew 63% overnight as a result of adopting revised standards for its system of national accounts. When Nigeria rebased its GDP in 2014 for the first time in 24 years—likewise in an effort to comply with international data standards—its economy almost doubled, making it Africa’s largest. These large revisions aside, discussions of international data standards are typically not what keeps most people at the edge of their seats.
As part of the 2021 World Development Report: Data for Better Lives, the World Bank recently launched the Statistical Performance Indicators (SPI). The SPI assesses the performance of countries’ statistical system across five pillars: (1) data use, (2) data services, (3) data products, (4) data sources, and (5) data infrastructure. In this blog post, we explore pillar 5, which includes indicators on countries’ use of internationally accepted and recommended methodologies for data standardization. Pillar 5 of the SPI has five sub-components or dimensions and the adoption of international standards and methods falls under dimension 5.2. Much of the data for dimension 5.2 comes from the IMF.
The data show that the adoption of international standards and methods is highly uneven. For example, only half of all countries use the most recent system of national accounts and more than one-third of countries have a national accounts base year older than ten years. An outdated system of national accounts and base year can lead to incomplete coverage of economic sectors and underestimation of the size of an economy, as seen in the large GDP revisions for Ghana and Nigeria. But also outdated base years for consumer price indices (41% of countries) and the non-adherence to international frameworks in the compilation of government finance statistics (45%) and employment data (62%) can paint a wrong picture of the state of an economy and fiscal spaces.
The adoption of international standards and methods is highly uneven
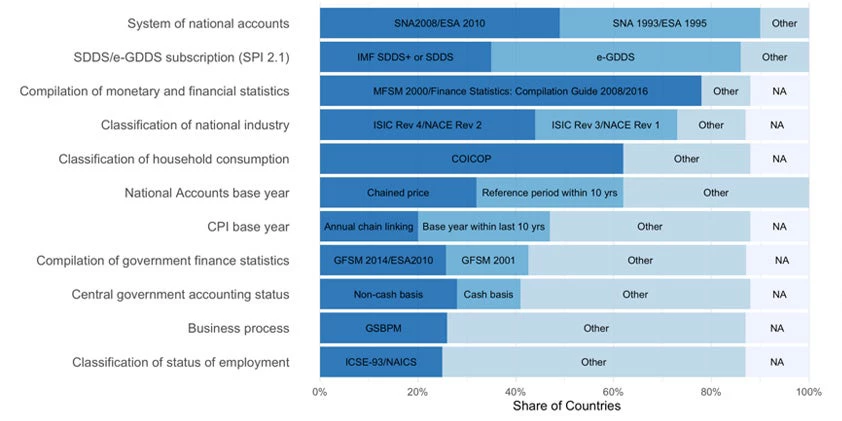
Note: The graph shows the adoption of international data standards as of 2019. Dark blue colors indicate countries that comply with the most recent international standards in the particular domain, the intermediate blue color represents countries that comply with outdated international standards, while the light blue color represents countries without adherence to international standards altogether. SPI Dimension 5.2 includes all measures except SDDS/e-GDDS which represents its own dimension 2.1. For a detailed description of the SPI, the different international data standards, and their scoring, please refer to this technical note.
The lack of international standards is particularly severe among poorer countries. Whereas around 60% of high-income countries comply with at least half of the most recent international standards (in dimension 5.2 of the SPI), this only applies to 28% of lower-middle-income and 7% of low-income countries. And progress has been slow in in recent years.
Poorer countries adopt fewer standards – and progress has been slow in recent years
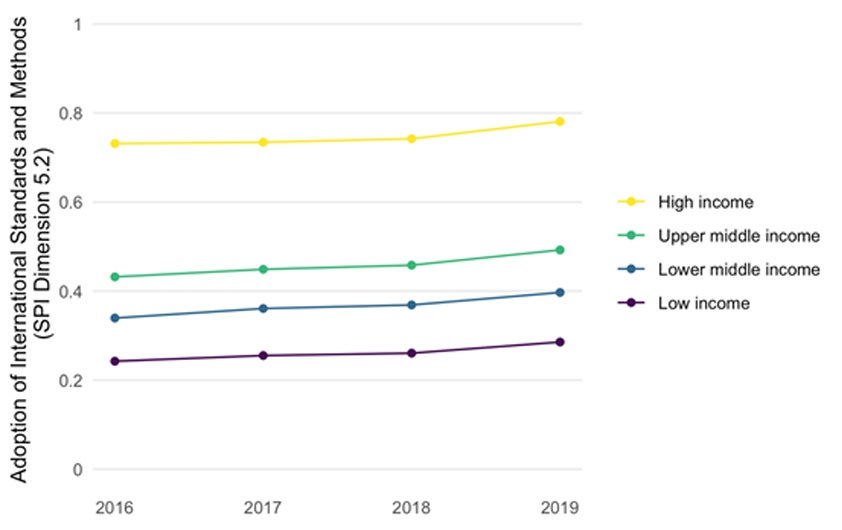
Note: SPI dimension 5.2 measures countries’ use of internationally accepted and recommended methodologies, classifications and standards regarding data integration on a scale from 0 (no adoption of international standards and methods) to 1 (full adoption of international standards and methods).
The World Development Report 2021: Data for Better Lives illustrates many ways in which data standards can promote development, from greater accountability to better policymaking to increased business opportunities. Yet, investing in data standards can also be costly especially if faced with capacity constraints and a lack of funding.
The good news is that adopting international data standards may at least partly pay for itself through lower borrowing costs. Previous research suggests that if data on macroeconomic fundamentals are more reliable, international investors may ask for lower yields on dollar-denominated government bonds. Consistent with this hypothesis, we find that the adoption of international standards (as measured by SPI dimension 5.2) is negatively correlated with a lower 10-year government bond spread —a measure of the additional cost of borrowing money for a country relative to the U.S.
Government bond spreads are negatively correlated with the adoption of international standards
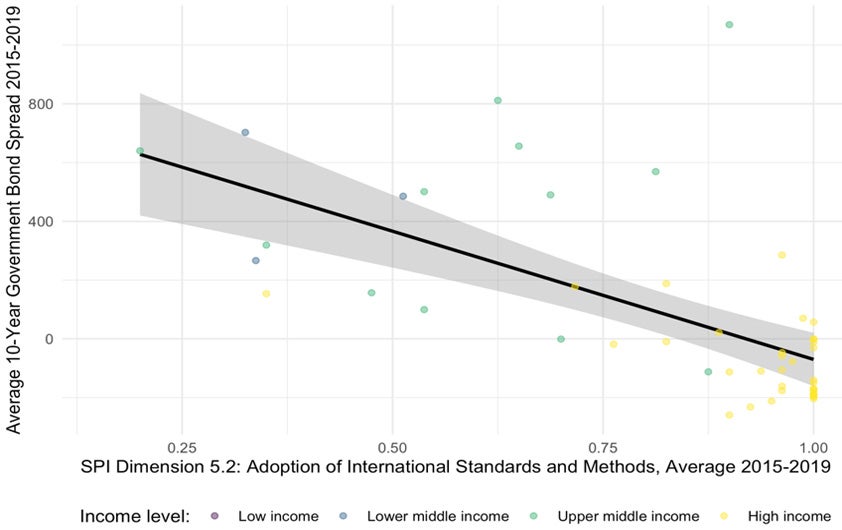
Note: Spread data were gathered through Bloomberg and measure the difference in yield between a country’s 10-year government bond and the U.S. 10-year Treasury bond in basis points (percentage points * 100). SPI dimension 5.2 measures countries’ use of internationally accepted and recommended methodologies, classifications and standards regarding data integration on a scale from 0 (no adoption of international standards and methods) to 1 (full adoption of international standards and methods).
The negative association also holds when controlling for other determinants of government bond spreads. Following an earlier study, we control for various “pull” factors of international capital such as GDP per capita, GDP growth, external debt, and inflation. We also control for global “push” factors such as the US federal interest rate and the VIX index (which is a measure of the stock market’s expectation of volatility) through the inclusion of year fixed effects.
We find that conditional on the macroeconomic fundamentals and changes in the global market environment, an increase in the adoption of international standards from the 25th percentile to the 75th percentile of SPI Dimension 5.2 is correlated with a decrease in government bond spreads by 169 basis points (see this GitHub repository for full results and replication material). This would be the equivalent of reducing your mortgage interest rate from 4% to 2.31%, for instance. The association is statistically significant and while not identifying a causal effect, it is consistent with the realization of large savings through the adoption of international standards.
So while systems of national accounts, base years, and industry classifications are typically not what keep most people up at night, perhaps they deserve more attention from data producers. Not only are such standards crucial to get an accurate image of the state of the economy, government finances and more, the strong correlation between the adoption of international standards and external borrowing cost suggest that the adoption of standards may, at least partly, pay for itself.


Join the Conversation