Current forecasts suggest that the coronavirus (COVID-19) global recession will be the deepest since World War II, with the largest fraction of economies experiencing declines in per capita output since 1870. Output of emerging market and developing economies (EMDEs) is expected to contract in 2020 for the first time in at least 60 years.
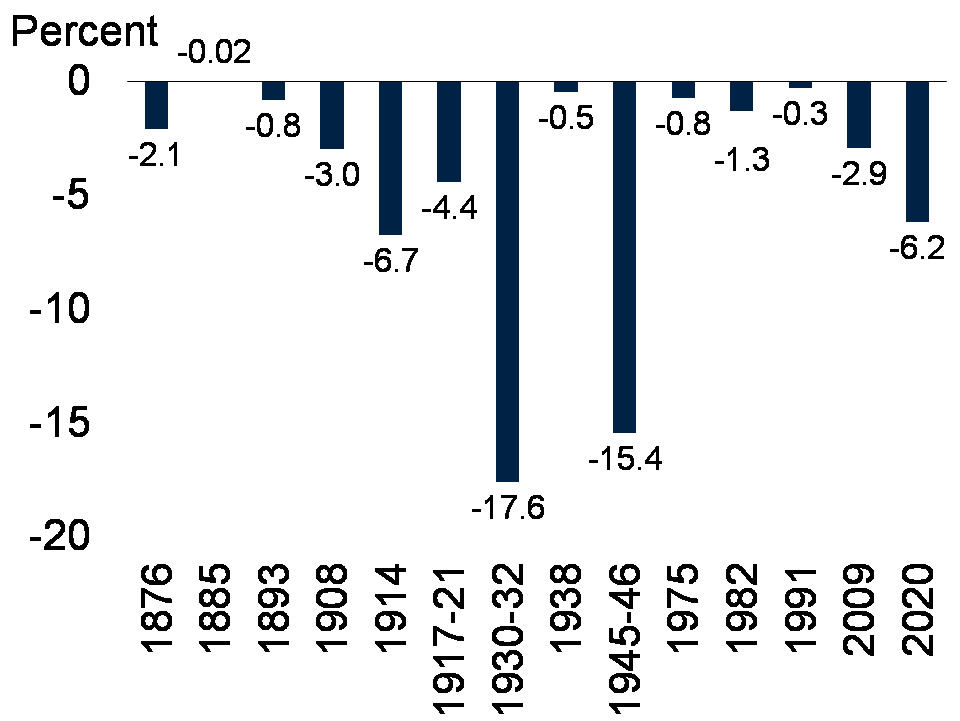
Chart 1. Deepest global recession since World War II
The global economy has experienced 14 global recessions since 1870: in 1876, 1885, 1893, 1908, 1914, 1917-21, 1930-32, 1938, 1945-46, 1975, 1982, 1991, 2009, and 2020. The COVID-19 recession will be the deepest since 1945-46, and more than twice as deep as the recession associated with the 2007-09 global financial crisis.
Global per capita GDP growth
Chrt 2. Highest synchronization of national recessions since 1870
In 2020, the highest share of economies will experience contractions in annual per capita gross domestic product (GDP) since 1870. The share will be more than 90% higher than the proportion at the height of the Great Depression of 1930-32.
Economies with contractions in per capita GDP
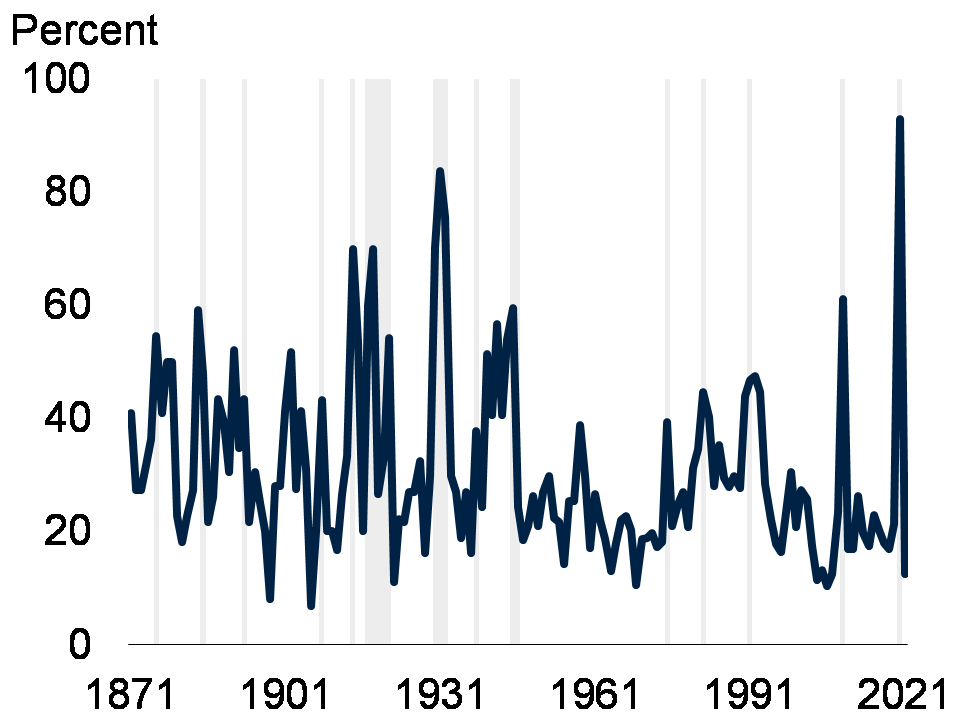
Chart 3. Sharpest contraction in multiple measures of activity
In 2020, many indicators of global activity are expected to register the sharpest contractions in six decades. A large swath of services has seen a near sudden stop, reflecting both regulated and voluntary reductions in human interactions that could threaten infection. Partly owing to an unprecedented weakening in services-related activities, global trade and oil consumption will see record drops this year, and the global rate of unemployment will likely climb to its highest level since 1965.
Retail sales volume during global recessions
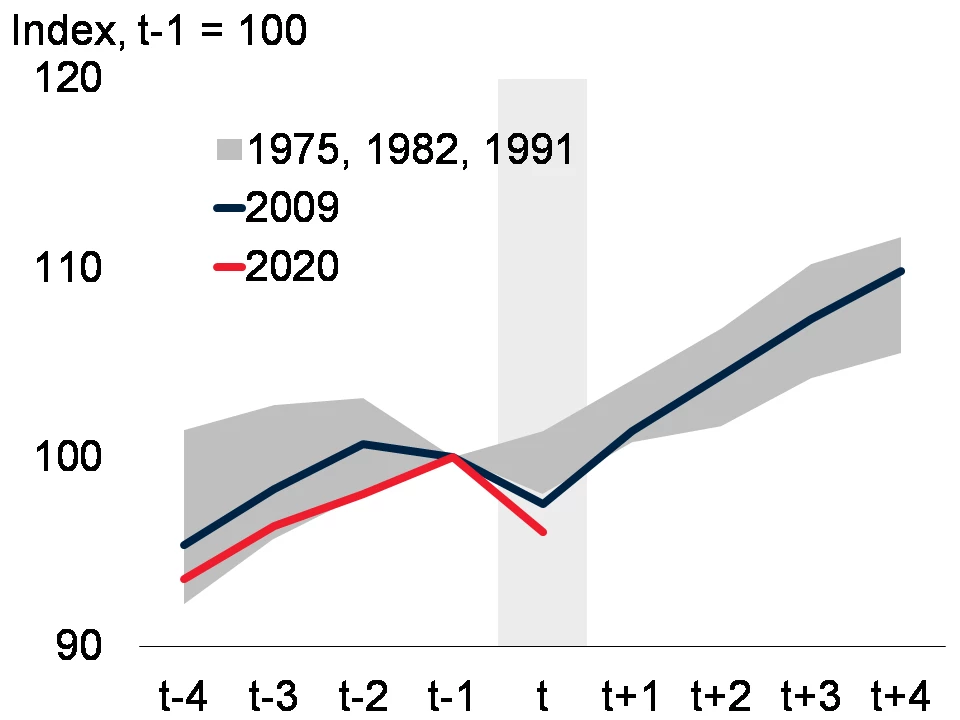
Chart 4. Sharpest decline in oil demand
Oil consumption typically fell during global recessions. The previous largest decline in oil consumption occurred in 1980-82, when consumption fell by a cumulative 9% from its peak in 1979. The outbreak of COVID-19 and the wide-ranging measures needed to slow its advance have precipitated an unprecedented collapse in oil demand. They also resulted in a surge in oil inventories, and, in March, the steepest one-month decline in oil prices on record.
Oil consumption during global recessions
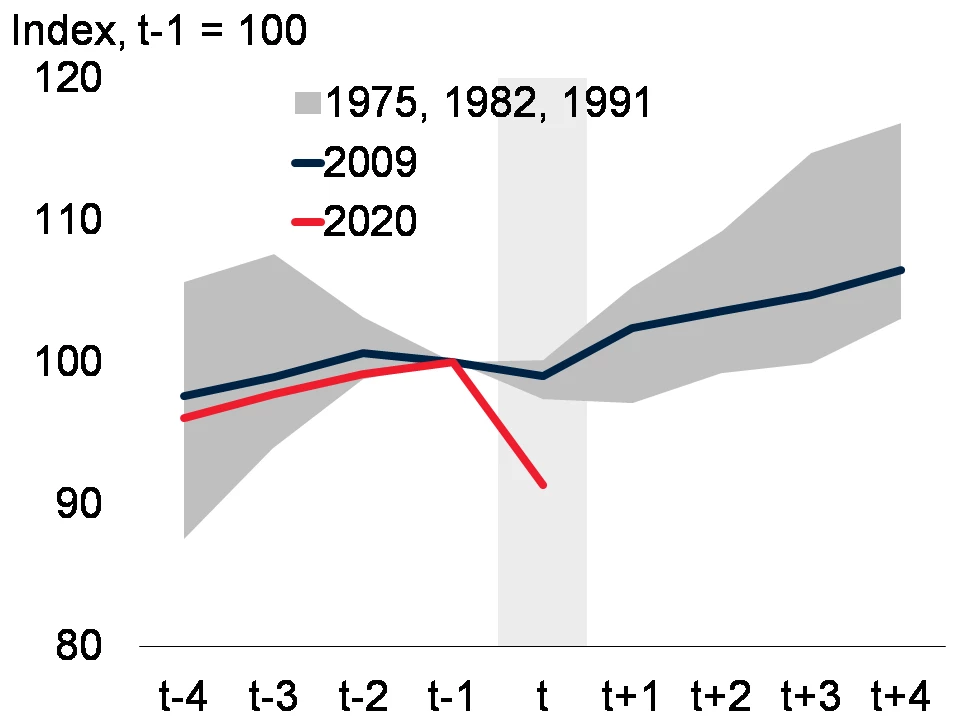
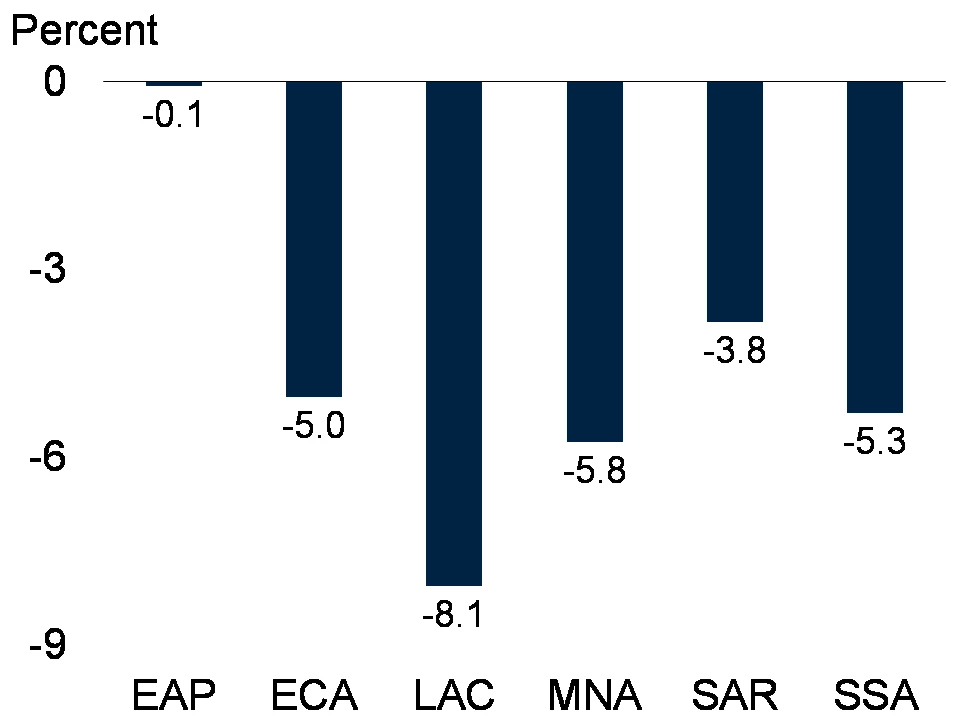
Chart 5. Declines in per capita output in all EMDE regions
Although the magnitude will vary across EMDE regions, current projections indicate that five out of six are projected to fall into outright recession. The majority of EMDE regions will experience the lowest growth in at least 60 years, and all of them will see declines in regional per capita output for the first time during a global recession since 1960.
Per capita GDP growth in 2020, by region
The COVID-19 global recession is unique in many respects. It will be the most severe since World War II and is expected to trigger per capita GDP contractions in the largest share of economies since 1870. It is also associated with unprecedented weakening in multiple indicators of global activity, such as services and oil demand, as well as declines in per capita income in all EMDE regions.


Join the Conversation