The World Bank will start using new poverty lines in fall 2022. The decision follows the release in 2020 of new purchasing power parities (PPPs) by the International Comparison Program (ICP). PPPs are the principal data used to convert different currencies into a common, comparable unit and account for price differences across countries. The new poverty line of $2.15 is based on 2017 PPPs. In nominal terms, it is a quarter of a dollar higher than the current $1.90 poverty line, which is based on PPPs released for the 2011 reference year.
Since 1990, when the World Bank started using a poverty line to define extreme poverty, the line has been derived from the national poverty lines of some of the poorest countries in the world at the time. As such, it reflects how poor countries define poverty.
Ferreira et al. (2016) derived the current $1.90 line as the mean of 2011-PPP-adjusted national poverty lines of 15 poor countries in and around the 1990s, which Ravallion et al. (2009) originally identified. We could have continued this tradition by updating the national poverty lines of these same 15 countries with the 2017 PPPs, but we have chosen to follow a new methodology developed by Jolliffe and Prydz (2016) that improves the current methodology in several ways.
Here are a few reasons for this change in methodology:
- First, the national poverty lines for these 15 countries were identified from a relatively small sample gathered more than a decade ago and were not necessarily the poorest countries in the world even then. Four of them are currently middle-income countries.
- Second, the national poverty lines of these countries were not expressed in comparable units: some were in per capita terms while others were in adult equivalent terms.
- Third, historical Consumer Price Index (CPI) data are required to convert these old national poverty lines into the prices of the ICP reference year (in this case, 2017). Since the poverty lines for these 15 countries date back to 1997 on average, 20 years of CPI data are needed to bring them to 2017, which may introduce measurement error, especially for countries with limited statistical capacity.
- Fourth, estimating the mean of the national poverty lines from a small reference group of 15 poor countries provides limited statistical support for the international poverty line (IPL), leaving it susceptible to measurement errors in the estimated national poverty lines.
Following Jolliffe and Prydz (2016), we take recent national poverty rates reported by countries themselves and retrieve the corresponding national poverty lines from consumption or income distributions denominated in 2017 PPP per capita units (see an example here for Bolivia). This approach produces harmonized national poverty lines because all estimated poverty lines are expressed in per capita, 2017 PPP U.S. dollars. We select the line closest to the 2017 ICP reference year for each country and define the new IPL as the median of the harmonized national poverty lines for low-income countries. More than three-quarters of the selected surveys were conducted within three years from 2017, and we have data for 28 out of 34 low-income countries. While addressing all four issues above, the new methodology still relies on national poverty lines, thus reflecting countries’ own definitions of poverty.
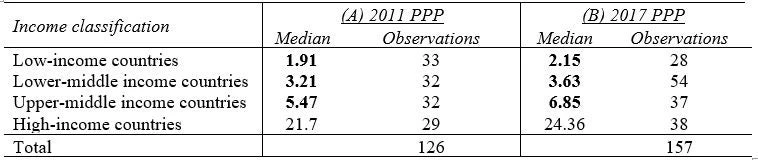
Jolliffe and Prydz (2016) used this methodology to define two higher lines — $3.20 (2011 PPP) and $5.50 (2011 PPP) — based on national poverty lines for lower- and upper-middle-income countries, respectively (see Table 1, panel (A)). With updated data, these higher lines are now being updated to $3.65 (2017 PPP) and $6.85 (2017 PPP), rounding to the nearest five cents (see Table 1, panel (B)). With the adoption of the 2017 PPPs, we now follow the same methodology in defining the IPL and higher lines.
Table 1: Updating global poverty lines with harmonized national poverty lines
Note: See Jolliffe ⓡ al. (2022) for more details.
Since the IPL is the most widely used line, we have conducted additional analyses to check the robustness of $2.15:
- First, we use different sets of poorest countries to define the line. We order countries by GDP per capita in 2017 PPP and plot the cumulative mean and cumulative median of the harmonized poverty lines in 2017 PPPs, sequentially increasing the pool of countries starting with the country with the lowest GDP per capita. Figure 1 shows that, using anywhere between 11 and 41 poorest countries, the median poverty line rounds to $2.15. This suggests that using the median harmonized poverty line of low-income countries is robust to using a smaller or larger set of poorest countries.
Figure 1: Cumulative mean and cumulative median of harmonized national poverty lines
- Second, to address the concern that the new line might be shifting the goalposts, we derive an equivalent IPL that keeps global poverty unchanged in a pre-defined reference year. Let’s provide some perspective: When the World Bank revised the dollar-a-day line to $1.25 (2005 PPP), we learned that the developing world was much poorer than previously thought. Such shifts in global poverty profiles distort the yardstick for tracking poverty over time.
Given that the above concern is expressed in the Atkinson Commission on Global Poverty, it is important that the 2017 PPPs do not shift nor appear to shift the goalposts. We can check this by determining the poverty line in 2017 PPPs that would result in the same global poverty rate as with the 2011 PPPs. $2.17 is the line that holds constant global poverty in 2017, the year of the PPP data. It is consistent with a $2.15 poverty line when rounded to the nearest five cents.
More details are available in the recent working paper. The paper shows that different estimation methods and assumptions converge to an IPL of $2.15 in 2017 PPPs, which will replace $1.90 in 2011 PPPs.
The authors gratefully acknowledge financial support from the UK Government through the Data and Evidence for Tackling Extreme Poverty (DEEP) Research Program.


Join the Conversation