 When we evaluate the benefits of public transport projects, we often focus on travel time (in terms of distance covered), vehicle cost savings, accident reductions and environmental impacts (air emissions and greenhouse gas reductions), which are all important dimensions of a project, but not the only ones. The reliability of transport services and information delivery regarding routes, frequencies and arrival time at each station, is not frequently included in the benefits of transport projects because it is difficult to gauge the significance and value of even a 5-10 minute difference in waiting time.
In light of this challenge, we began to explore the following question: what are the real implications of waiting time, frequency and reliability of transport systems in terms of improving access to urban opportunities such as education and health services?
In a series of blogs, we introduced a new tool that helps us quantify urban accessibility to such services. This tool allows us to calculate how many opportunities -be it jobs, schools, hospitals- become more accessible using public transport. The tool is also useful for comparing various transportation scenarios, modes of transport, service and infrastructure plans, as well as for better understanding land use and spatial patterns.
One of the features of this tool, for example, is that it lets us examine the impact of service reliability on access to various opportunities. Besides calculating the average accessibility, the tool allows us to compare two distinct scenarios:
- Worst-case scenario: the waiting time for services is calculated as the maximum amount of time a person will wait. (Waiting time equals to headway)
- Best-case scenario: the waiting time for services is calculated to be negligible.
 Using this methodology, we started to explore the difference in accessibility to jobs due to changes in service reliability of public transport. The results were more surprising than expected.
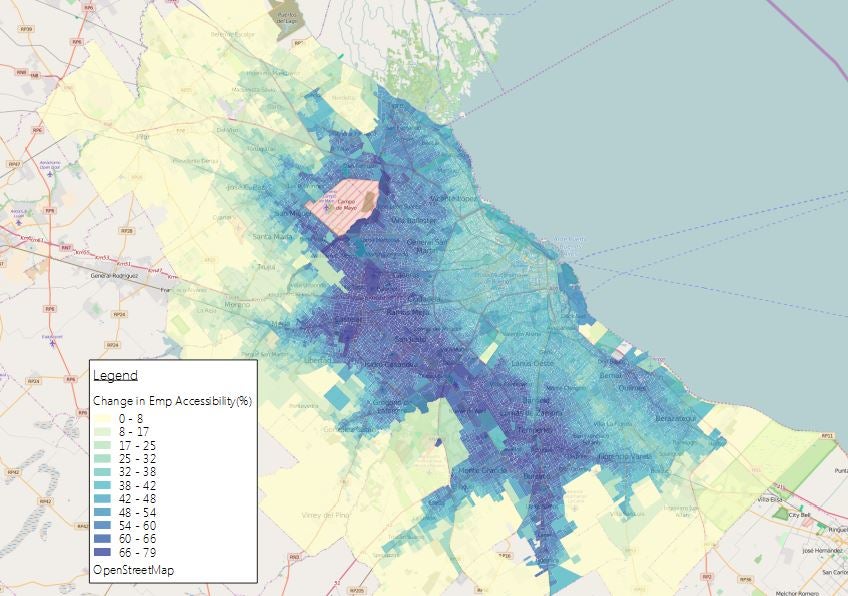
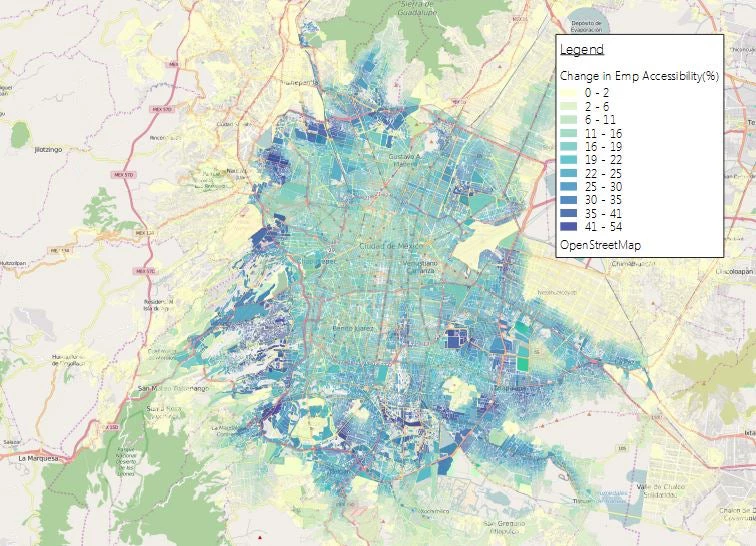
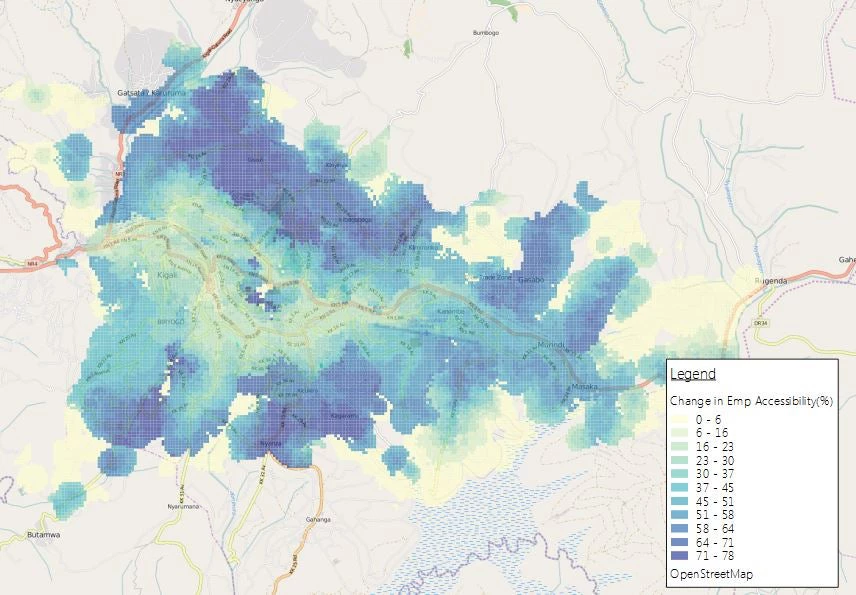
Comparing the difference in accessibility from the best case to the worst-case scenario, we found that the Job Accessibility Index (percentage of jobs that are accessible within 60 minutes using public transport on average) increased from 19% to 63% in Buenos Aires, a change of 44% of jobs that are more accessible. This is not unique to Buenos Aires or other Latin American cities, since we have observed the same patterns in other cities around the world. For example, optimal transport operations yield increases in accessibility of 54% in Kigali, 11% in Lima, and 14% in Cairo.
The changes in accessibility are even larger when we see the spatial distribution of accessibility in different parts of a city. Employment accessibility in different parts of a city increases by 89% in Lima, 79% in both Buenos Aires and Kigali, and 54% in Mexico City.
Furthermore, the areas in which accessibility increases the most is often in the city’s peripheries, where most of low-income people live. So this accessibility can have an important impact in terms of poverty reduction and economic growth for the bottom 40% of city dwellers.
 This means that improving the reliability of services preforms better, in terms of accessibility to opportunities, than simply building big infrastructure projects. What we found in Lima, for example, was that the changes in accessibility from constructing a metro line only deliver about half of the improvements than if we had run the current system under a best-case scenario (with more reliable frequencies, waiting time, information).
All this means that without proper frequencies, travel time and monitoring of services, what we often see in cities is that transport services do perform at the worst-case scenario.
The policy implications of these results therefore are immense. Some of these include:
- Operations: monitoring the operations of public transportation services has large effects on the overall network performance.
- Information Delivery: in order for the waiting time to be negligible, it is essential for users of the system to have information about the services available as well as detailed information on service frequency. Fortunately, information delivery tools are freely accessible, and leverage open standards, GTFS (General Transit Feed Specifications). This allows users to know what the schedule time is for transport services in each of the stops.
- Technology: new developments in technology are an essential tool for improving services’ reliability. Automatic vehicle location (AVL) data, provided by placing GPS services on buses, allows agencies to monitor, in real time, the performance of each of their services. Furthermore, GTFS-Real Time converts the GPS data into information for the user – which allows the user to see, in real time, when the next service will be available.
But our research also shows that the benefits of running the buses and trains on time can be immense, particularly in providing more opportunities for the poor.
Do you know of other examples of how the reliability and frequency of transport systems can improve access to urban opportunities?

Join the Conversation