A guide to the top World Bank blogs and blog posts of 2012

|

This page in:

Last year I wrote a post listing the most read 100 World Bank blogposts of 2011. I also compared the Bank’s 26 English-language blogs with one another in terms of how many posts they got in the top-200. 2012 was an even more successful year for World Bank bloggers.

Fig 1 compares the Bank’s 29 blogs in terms of their shares of the top-200 posts for both 2011 and 2012. (I excluded pages that didn’t look like posts – blog home pages, blogger profiles, thematic pages, and so on. I may have inadvertently dropped some posts in which case my apologies to the blogger.) Africa Can End Poverty retains the number one slot, accounting for 20% of the top-200 in both years. Development Impact, which started mid-way through 2011, increased its share to 10% in 2012 with 20 posts in the top-200; it now occupies 2nd position. Last year’s runner-up (East Asia & the Pacific on the rise) slipped to 4th position this year, and last year’s #3 (Let’s Talk Development) slipped to 5th position. Open Data, new this year, came in strongly at #7. Voices - Perspectives on Development improved its position considerably, while Development in a Changing Climate slid the other way.

Fig 1: Number of posts among the top-200, 2011 and 2012*
Click to enlarge

Fig 2 shows the sharp growth of interest in blog posts between 2011 and 2012. The top 200 posts across the Bank notched up 460,000 page views in 2011 but as many as 620,000 page views in 2012. The 40 or so most popular posts on Africa Can End Poverty accounted for 110,000 views in 2011 but as many as 150,000 in 2012.

Fig 2: Page views of the top-200 blog posts, 2011 and 2012*
Click to enlarge

Table 1 lists the top-100 posts of 2012. Interestingly, three of the top four were also in the top four last year – evidence against the commonly held view that blog posts typically have a very short shelf life. Click here for a longer list containing the top-200 Bank blog posts of 2012.

Table 1: Top-50 World Bank blog posts 2012*

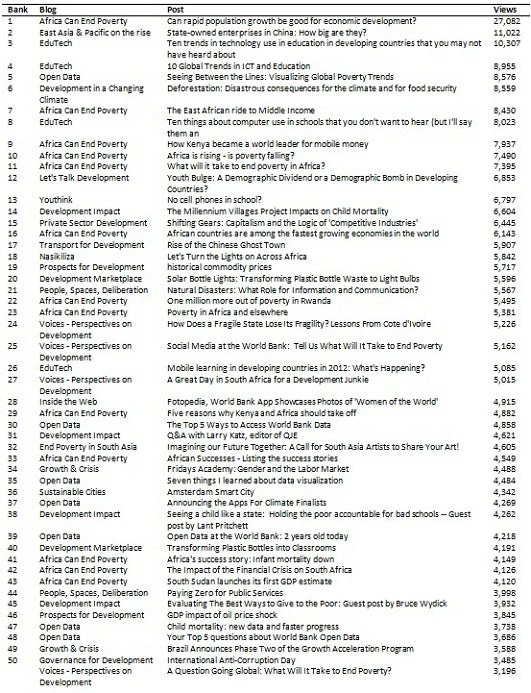
* The period covered is January 1, 2012 – December 3, 2012. Data on views were obtained from Omniture, which apparently gives more precise – and typically lower – page view figures than the Bank’s blogger platform which also gives data on views but only to individual bloggers on their posts.

Authors

Adam Wagstaff

Research Manager, Development Research Group, World Bank

David McKenzie
December 18, 2012

This omniture data (which is much lower than the page views from the blogger platforms) don't capture people who read the Bank's blogs through email subscriptions or RSS feeds and don't click through. For example, if you look at Google Reader subscribers you find:

Development Impact: 1250
Africa Can: 997
EduTech: 899
Let's Talk Development: 359
People, Spaces, Development: 226
East Asia and Pacific on the Rise: 153

Development Impact and Africa Can post their full content to their RSS feed, whereas some other blogs like Let's Talk Development require you to click through to get the full post - the former would not be captured by omniture whereas the latter would be.

Anyway, good to see the growth in readership of Bank blogs, but these statistics understate this growth.

Antonina
December 19, 2012

Congratulations to all staff, who were behind the idea to establish and nurture the blog platform on the Bank's website. Congratulation to talented and enthusiastic writers who contribute content to the blogs. Looking at the numbers, readers surely appreciate the effort.

Adam Wagstaff
December 19, 2012

Thanks, David.

I was also curious about the discrepancy between the Omniture and blogger platform figures. Among my posts, the latter are on average 4.5 times the former, but with a big spread: in one case the blogger platform figure is just twice the Omniture figure; in another case, it’s 13 times. What I’ve been told by the Bank’s IT expert on webmetrics is that, unlike the blogger platform system, Omniture tries to detect what’s a real visit, and filters out things like search robots, spambots that are trying to submit spam comments, etc. Consistent with this explanation is the fact that I got a record (for me) 95 spam comments on the post where the blogger platform readership figures was 13 times the Omniture figure. Interestingly, the discrepancy is substantially and significantly higher for my 7 posts with the expression “knowledge bank” in the title. Anyway, the Bank’s expert on the subject says to treat the blogger platform stats with a huge grain of salt for the time being, and to go with the Omniture stats.

It’s true that when someone reads the entire post through an RSS feed (without having to click through to get more than the first few lines) this won’t get reflected in Omniture. But are RSS subscription numbers a good guide to the number of people actually reading individual posts? Personally, I read only a very small percentage of the posts that come to me through my Google Reader subscriptions. It’s possible of course that the reading rate varies from one blog to the next, with the subscribers to some blogs (DE?) religiously reading every post that comes their way and subscribers to others being choosier. The best way, it seems to me, to get at the question of how many RSS feed subscribers actually read specific posts is surely to force them to click-through in order to read the whole post. That, I’m told, is the “industry” norm.

Best,

Adam

Homira
December 19, 2013

Thank you for keeping us updated on these blog figures Adam. It reflects your innate commitment towards transparency in knowledge management, as well as good science. I totally agree with you on the RSS feeds - I rarely read all the ones I subscribe to also. Keep up the good work. You keep us inspired.

Edo Berrios Cerda
December 21, 2013

This is an interesting summary of blogs and blog posts on your site, thank you.