Accessibility analysis is an essential element of understanding cities and public service delivery. Activity‐based accessibility measures relate to the distribution of activities (for example, jobs or schools) in a given space, and the ease of reaching these activities. This type of measure directly relates to the qualities of a multi-modal transport system (e.g. transport network, speeds and costs), but also includes the qualities of the land‐use system (e.g. distribution of land uses, and thus activities), and allows for a spatial temporal multi-modal analysis based on changing land uses.
Accessibility offers a powerful lens to assess how a mobility system is serving an urban area. For example, road congestion is a more severe constraint in a dispersed setting with few transit, walking and cycling options (such as the Atlanta metropolitan area), compared to traditional mixed-use downtowns (such as New York City), where residents can access jobs and other opportunities walking, cycling and using mass transit.
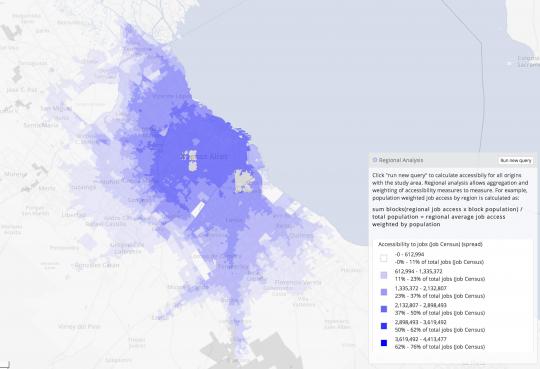
Block-level measure of job access within 60 minutes by public transport
Accessibility indicators are not just conceptually powerful – they are also easy to operationalize: the number of jobs accessible within a 60-minute timeframe is a popular and powerful indicator to evaluate how well the mobility system is serving a particular spatial area, or group of people (such as the most vulnerable).
Comparing this measure across parts of a region allows a powerful visualization of the extent of spatial inequality. It also serves as a benchmark to assess the impacts of an intervention such as a mass transit investment (e.g. this investment allows the bottom 40 percent in the urban area to access
x more jobs in a 60-minute timeframe) and to compare urban areas.
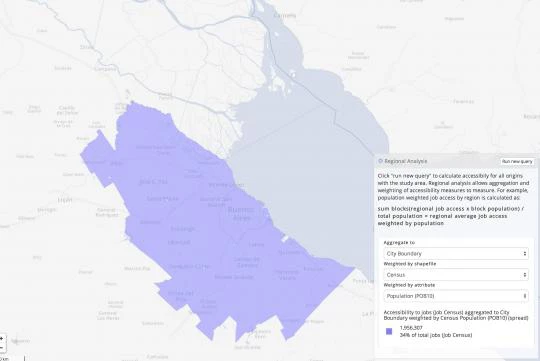
The urban economist Alain Bertaud describes a measure that essentially integrates the share of a metropolitan area’s jobs accessible in 60 minutes across the region to calculate the effective size of the labor market in a metropolitan area. The value of 0.34 of this measure for greater Buenos Aires suggests that on average, someone living in Buenos Aires can access approximately 34 percent of the jobs in the metropolitan area in 60 minutes – recognizing that actual accessibility varies across the population depending on their location.
Aggregate citywide job access within 60 minutes, weighted by population
One of the factors that has so far limited more widespread use of accessibility as a planning/monitoring tool is computational difficulties. Accessibility analyses require basic spatial data on the road and public transport system, as well as spatially disaggregate data on indicators of interest such as population, jobs, location of schools and hospitals. In this context, the recent advances with Open Data – including tools such as
OpenStreetMap, and
open transport data in GTFS format – have allowed for
accessibility analysis using open source software. I am excited to say that we at the World Bank have helped make accessibility analysis one step easier by developing a user-friendly version of the open-source OTPA tool.
Read the paper:
Accessibility analysis of growth patterns in Buenos Aires, density, employment and spatial form
Import public transport schedules. The tool uses schedules in the GTFS format, and can create GTFS files from commonly available GIS files (shapefiles) exported from standard transport planning software (this blog describes more detail), or even create a schedule by tracing a route on a map.
The tool currently allows users to assess accessibility by public transport, cycle and auto (quality of cycle and auto travel speed depends on available data) from any single point in the region (data that can be saved or exported as an image); create a heat map of accessibility for the region as a whole (see Buenos Aires above) and calculate the Bertaud measure for the effective size of the labor market in a metropolitan region.
We are now creating a plan to move hosting to the World Bank and make the tool available for use for all World Bank projects. If interested,
please contact us. At this stage we are looking for collaborators to use these tools to evaluate:
Spatial growth patterns in a metropolitan area terms of their relative accessibility and the impact on overall metropolitan area accessibility.
The relationships between urban poverty and accessibility across metropolitan areas.
Public housing policies in terms of their likely impact on metropolitan area accessibility.
Compare incremental public transport improvements – such as a new bus line and corridor improvements – in terms of its impact on accessibility
What is particularly cool is the combination of Open Data and open source software that we hope will make this tool easy for cities and analyst to use and to adapt.
The underlying source code is available here, and we hope that over time others develop additional functionalities and analyses to complement this basic tool.
What do you think? Do you find the tool of interest? Do you have suggestions on how we can make it more useful for you? In the coming months, our immediate focus is to solicit such feedback and help colleagues – across Latin America and from cities ranging from Kigali, and Dhaka to Ulan Bator – to use and improve the tool. We hope to report back in a few months on the experience we have and potential improvements that are suggested, or perhaps have been developed.
More reading on accessibility: Tutorial Bertaud, Alain.
Cities as Labor Markets, February 19, 2014
Peralta Quirós, Tatiana and Shomik Raj Mehndiratta.
Accessibility analysis of growth patterns in Buenos Aires, density, employment and spatial form. Transportation Research Board 2015
Accessibility Observatory (also using and contributing the OTPA open source project to support their analysis)
Levinson, David. Accessibility and the journey to work. Journal of Transport Geography, 1998
Geurs, Karst T., and Bert van Wee. Accessibility evaluation of land-use and transport strategies: Review and research directions. Journal of Transport Geography, 12, 2004
Acknowledgement: This tool development was partially supported by the Energy ESMAP program.
Thank you for choosing to be part of the Transport for Development community!
Your subscription is now active. The latest blog posts and blog-related announcements will be delivered directly to your email inbox. You may unsubscribe at any time.
The e-mail address: [email] is already subscribed for newsletters.


Join the Conversation