 Pins on geographic map. | © shutterstock.com
Machine learning (ML) has become popular in various fields, including poverty mapping. Recently, there has been a surge in using ML methods and geospatial data to create detailed poverty maps.
Understanding where the neediest live is crucial for poverty alleviation. Hence, granular poverty estimates are vital for targeted interventions. However, traditional household surveys have limitations in precision and geographic coverage, hindering effective targeting at a detailed level . This is overcome with small area estimation—a statistical approach that combines data from household surveys with additional information from censuses, registers, GIS, or other sources to generate higher-quality estimates. By leveraging small area estimation techniques, policymakers can overcome the drawbacks of traditional survey data and obtain more reliable insights for designing effective interventions.
How are ML based poverty maps done and validated?
Most machine learning-based maps are created by establishing a model that captures the spatial correlation between a poverty measure obtained from a survey and geospatial data. ML maps are typically validated by calculating the R-square, which quantifies the proportion of variation in survey-based estimates that is explained by the predicted estimates. In certain cases, a correlation coefficient is also employed to gauge the strength of the relationship between the survey-based estimates and the predictions. Often, a high R-square value is used to advocate on the quality of the maps.
How good are poverty maps using machine learning?
In our new paper, Poverty Mapping in the Age of Machine Learning, we take advantage of a very detailed and large household survey, the 2015 Mexican Intercensal Survey, and use it as a census. Because the survey is treated as a census, the poverty rates for small areas in the data are our target. After taking 500 samples from our census, we obtain small area estimates of poverty using various methods.
As our ML method, we rely on gradient boosting machines using the following data:
- Census derived municipality level covariates (CEN-MUN)
- Publicly available municipality level GIS covariates (GIS-MUN)
- A mix of census derived and GIS covariates (ALL-MUN)
Our ML-based poverty maps are benchmarked against traditional methods for poverty mapping. Specifically, we benchmark ML maps against: unit-level poverty maps obtained from survey and census microdata where welfare values for the entire population are simulated; and area-level maps where poverty rates at the area level are modeled using area level characteristics.
We show that the quality of data used for poverty mapping is as important as the method. ML-based poverty maps with the appropriate data rival the traditional, more data demanding (e.g., requiring access to census microdata) maps done at the World Bank since the turn of the 21st century (figure 1). However, the quality of data is instrumental to obtaining high-quality poverty maps. Even the top ML algorithms cannot do much with poor data – the publicly available geospatial data used does not yield suitable estimates (figure 1, GIS-MUN estimates). When possible, combining geospatial data with higher quality data, such as census-derived aggregates or administrative data, could yield higher quality estimates (ALL-MUN).
Figure 1: Empirical Bias and MSE of different methods
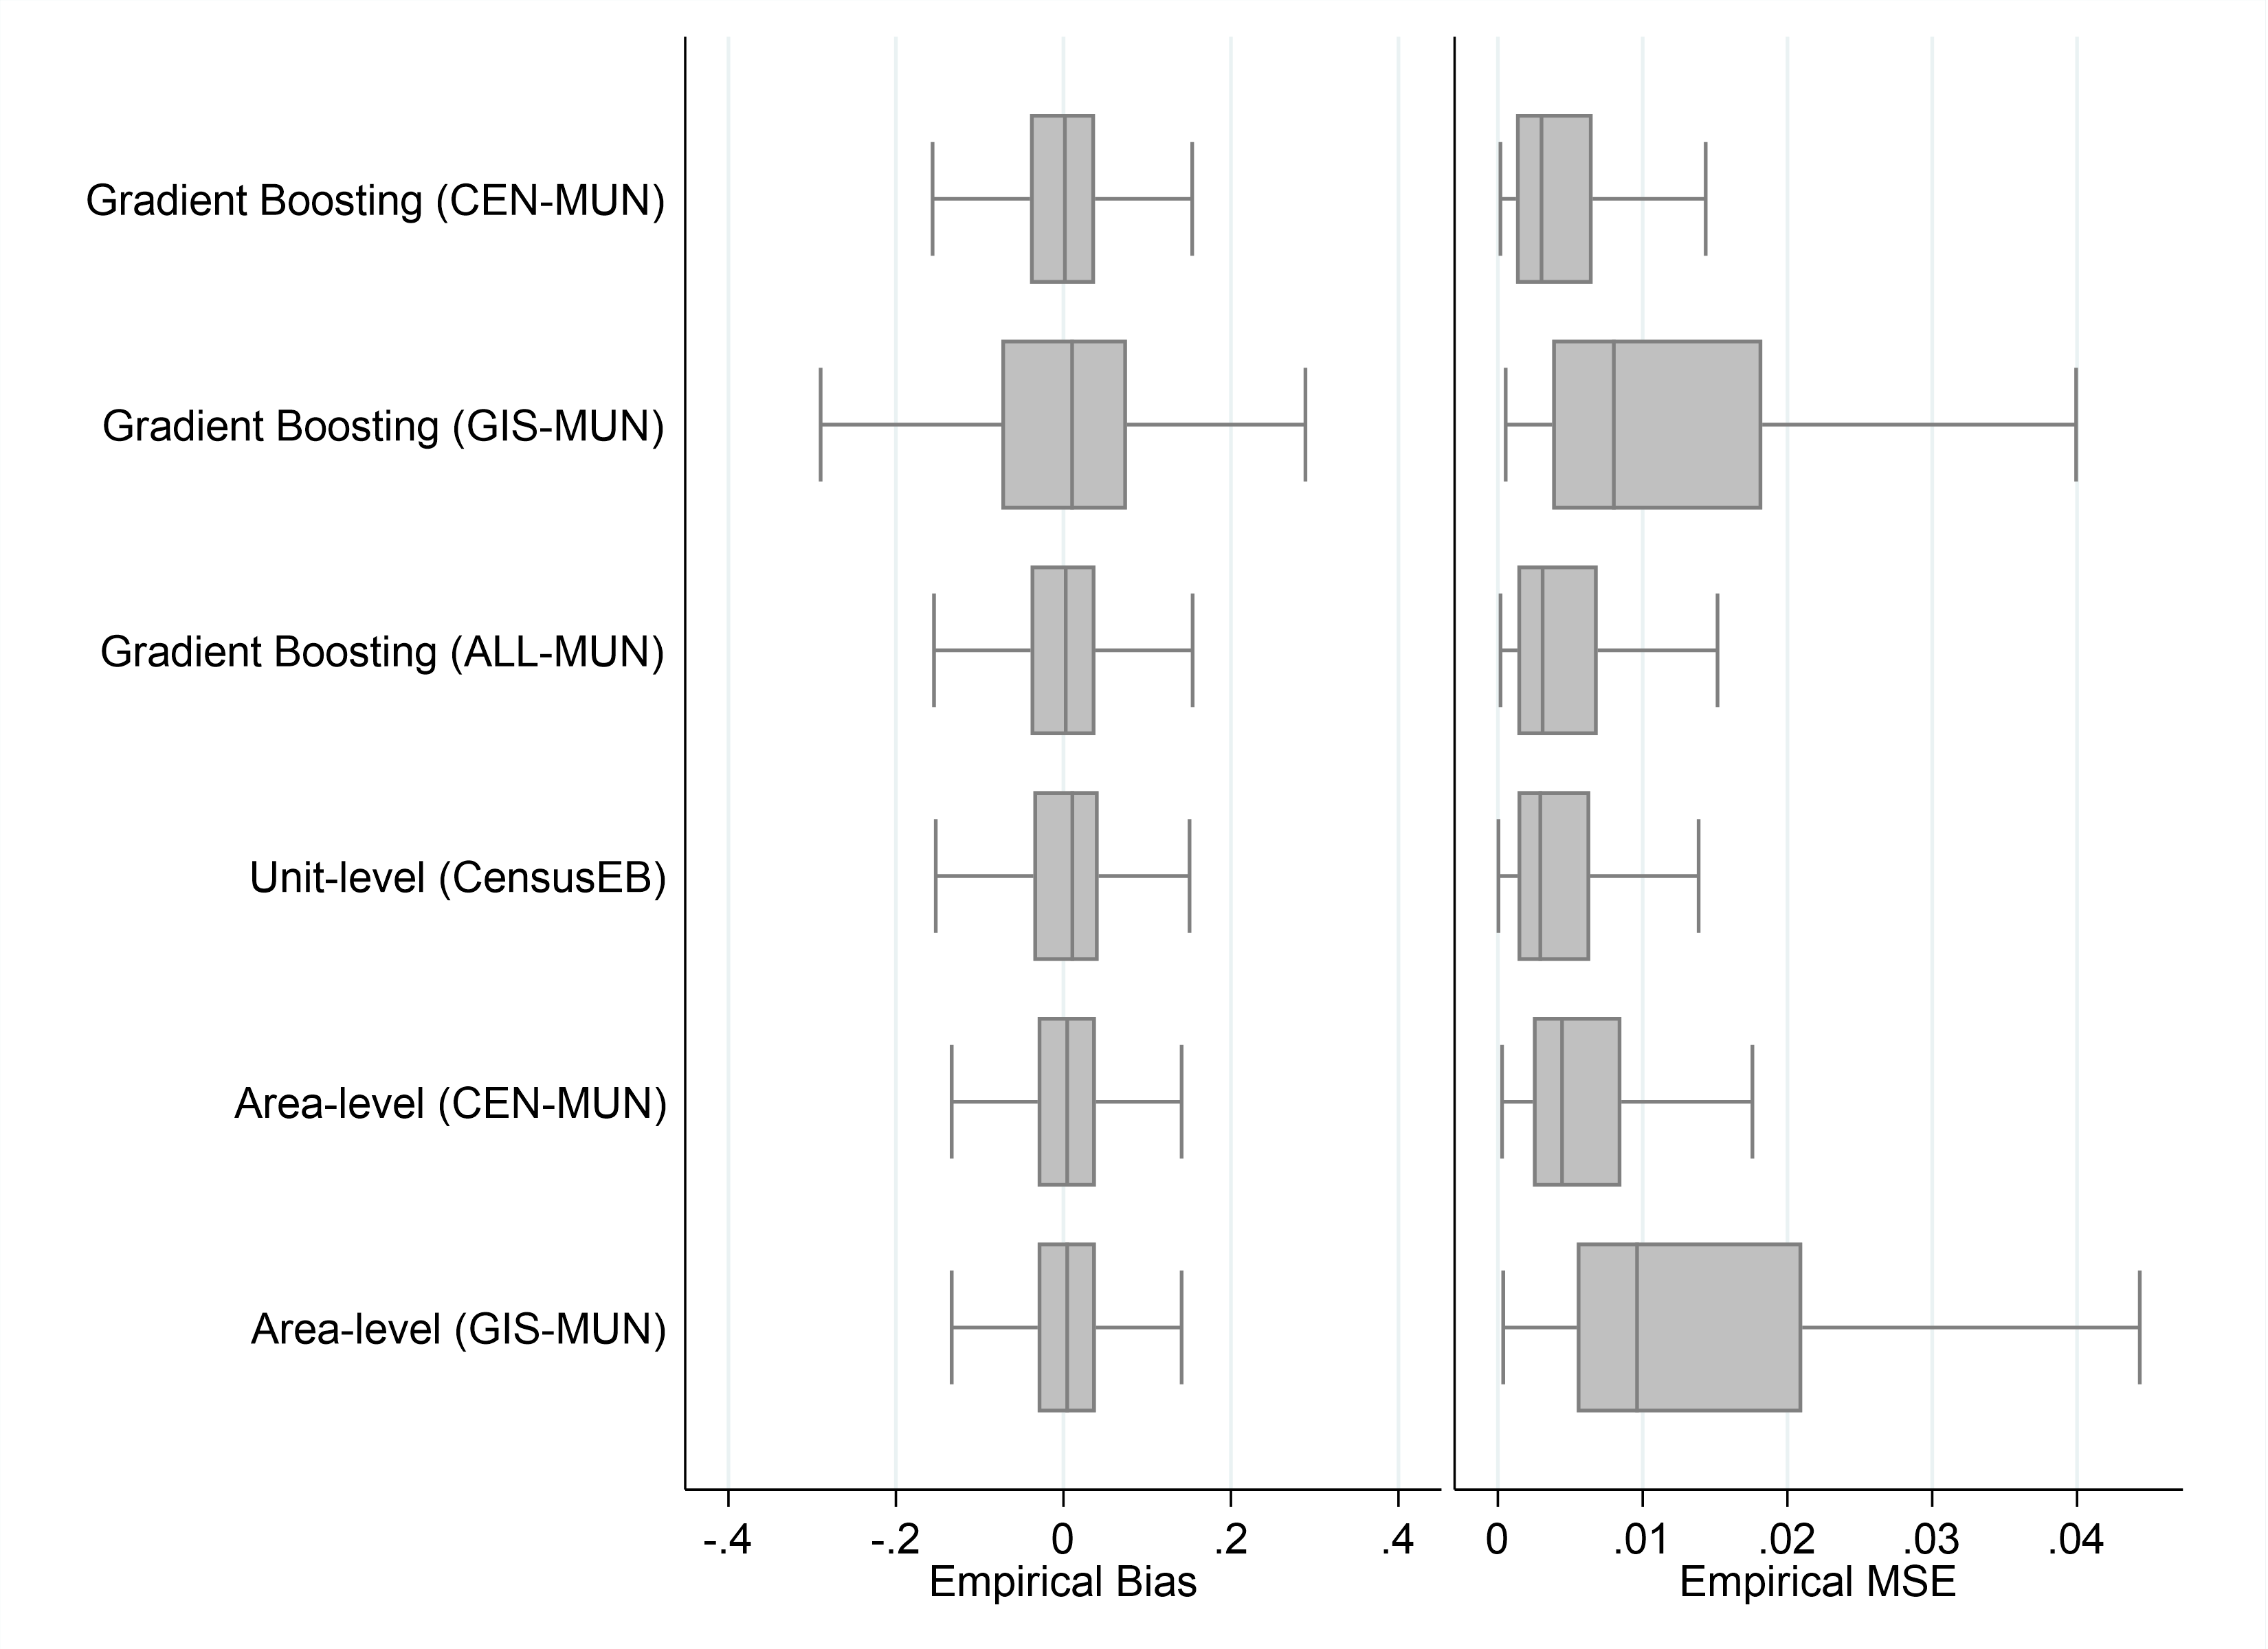
Note: The box-plots show the municipality level spread of the design MSE and bias of the method’s estimates across the 500 samples drawn from the census.
Why don’t we use the R-square measure or correlations to assess our estimates?
The goal in poverty mapping is to estimate the true poverty rate. Because survey-based estimates are inherently prone to noise, they provide a somewhat imprecise approximation of the actual value. Consequently, the strength of the relationship between predictions and survey-based estimates is biased and may be very different when assessed against the true poverty rates.
Additionally, the R-square and correlations are unaffected by systematic bias in the predictive model where poverty rates are systematically over or underestimated. Hence, the R-square and correlation measures used to validate poverty maps in the ML literature can be misleading in terms of model assessment because it yields incorrect information for choosing what may be the best set of estimates across different methods and scenarios.
What does this all imply for poverty mapping moving forward?
Our findings illustrate that ML holds promise for poverty mapping, but existing validations have not gone deep enough to evaluate its quality. The ML method-tested, gradient boosting machines—in terms of noise and bias—have the potential to yield estimates on par with unit-level poverty maps. Nevertheless, the quality of data used for modeling is key to obtaining high-quality poverty maps . When access to data beyond geospatial data is hindered, poverty maps must be used with care, applying extra effort to validate.
Machine learning-based poverty mapping can provide valuable insights for policymakers. But it is essential to critically evaluate the methods and data used to produce poverty maps to ensure their effectiveness for tackling poverty .


Join the Conversation