Economic growth has been vital for reducing extreme poverty and improving the lives of many poor people around the world. This is an indisputable fact.
However, does economic growth affect poverty reduction equally in different countries? Contrary to conventional wisdom, we don’t think so. And here’s why.
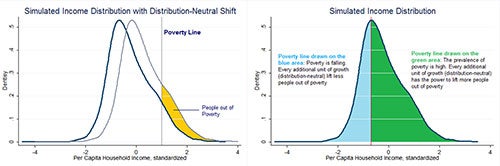
Using a country’s individual income distribution, which tells us how many people are living in extreme poverty (i.e. on less than $1.25 a day), we find that positive growth which is distribution-neutral shifts the income distribution to the right, without changing its shape (see Figure 1, left-pane). The share of people that emerge from poverty due to this distributional-neutral shift is depicted in yellow, which is the area between the two distributions and to the right of the poverty line. The number of people who are lifted out of poverty depends on the position of the poverty line across the distribution of income. So, for instance, growth of 1 percent lifts relatively fewer people out of extreme poverty when the poverty headcount rate is very high or low i.e. the extreme poverty line lies on top of either one of the tails of the income distribution.
Depending on where the extreme poverty line is relative to the peak of the income distribution – which is the statistical mode of per capita income – continued distributional-neutral growth will lift more people out of extreme poverty (to the right of the vertical line in the right-pane or the green area) or continued growth will start to lift less people out of extreme poverty, i.e. the extreme poverty line is to the left of the peak of the income distribution.
Figure 1: Income distribution, extreme poverty and the impact of growth
In Figure 2, we have calculated the impact of a 1 percent growth rate on the poverty headcount for each country and plotted it against the countries’ 2010 initial poverty rate. As expected, the impact of 1 percent growth is the highest when the extreme poverty line is close to the peak of a country’s income distribution – this usually occurs when headcounts are around 35 to 50 percent. In the same figure, the countries plotted using the green color, can expect that a continuation of growth will increase the impact of growth on extreme poverty reduction – as the poverty line is to the right of the mode of their country’s income distribution. In contrast, countries plotted using the blue color will face a declining impact of continued growth on their extreme poverty headcount as the statistical mode of a country’s income distribution is to the right of the poverty line.
Figure 2:
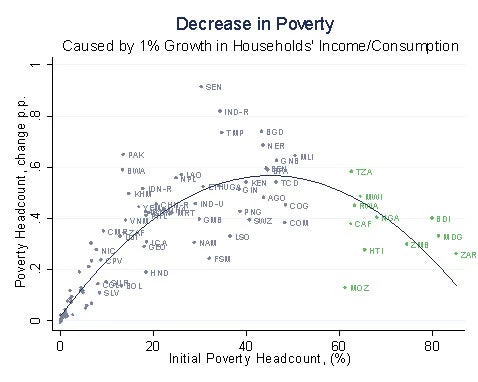
Source: Authors’ calculations using PovcalNet, http://iresearch.worldbank.org/PovcalNet/Index.html
To fully understand the implications of growth on the absolute number of extreme poor, it is also interesting to analyze how a growth rate of 1 percent reduces the number of extreme poor in each country. Figure 3 shows the outcome of that exercise. Clearly, the largest numbers of people that would be lifted out of poverty are in populous countries like India, China, Bangladesh, Indonesia, or Nigeria. However, depending again on where the initial extreme poverty line lies, relative to the mode of the income distribution of each country, the absolute number of poor being lifted out of poverty will increase or decrease respectively with additional growth. Again, we have colored the countries green, where additional growth would increase the impact on the absolute number of extreme poor and blue if not.
Figure 3: People lifted out of poverty due to 1% growth in household consumption
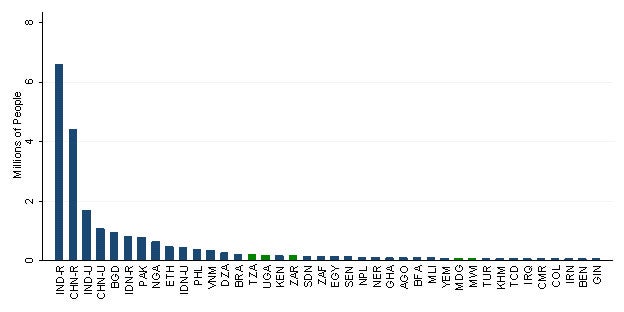
Source: Authors’ calculations using PovcalNet, http://iresearch.worldbank.org/PovcalNet/Index.html
Note: For visualization purposes, only countries with more a reduction of poverty in more than 50,000 people are depicted
Of course, every approach to calculating the impact of growth on poverty has its drawbacks, including the one we describe. An important one is that we take a growth rate of 1 percent, although hardly any country grows at this rate. Another one is that income distributions change over time and what we calculate, based on 2010 cross-country data, might not be relevant for today’s discussion at a specific country level (See earlier blog posts Poverty reduction, growth, and movements in income distribution and The role of changes in income distribution ). Nevertheless, we thought that it does provide some relevant information for development experts to take into account when designing strategies to end extreme poverty at the country, regional, and/or global level. In particular, it is important to know where the extreme poverty line is relative to the country’s mode of the income distribution as it has implications for the importance of growth in reducing extreme poverty.
However, does economic growth affect poverty reduction equally in different countries? Contrary to conventional wisdom, we don’t think so. And here’s why.
Using a country’s individual income distribution, which tells us how many people are living in extreme poverty (i.e. on less than $1.25 a day), we find that positive growth which is distribution-neutral shifts the income distribution to the right, without changing its shape (see Figure 1, left-pane). The share of people that emerge from poverty due to this distributional-neutral shift is depicted in yellow, which is the area between the two distributions and to the right of the poverty line. The number of people who are lifted out of poverty depends on the position of the poverty line across the distribution of income. So, for instance, growth of 1 percent lifts relatively fewer people out of extreme poverty when the poverty headcount rate is very high or low i.e. the extreme poverty line lies on top of either one of the tails of the income distribution.
Depending on where the extreme poverty line is relative to the peak of the income distribution – which is the statistical mode of per capita income – continued distributional-neutral growth will lift more people out of extreme poverty (to the right of the vertical line in the right-pane or the green area) or continued growth will start to lift less people out of extreme poverty, i.e. the extreme poverty line is to the left of the peak of the income distribution.
Figure 1: Income distribution, extreme poverty and the impact of growth
In Figure 2, we have calculated the impact of a 1 percent growth rate on the poverty headcount for each country and plotted it against the countries’ 2010 initial poverty rate. As expected, the impact of 1 percent growth is the highest when the extreme poverty line is close to the peak of a country’s income distribution – this usually occurs when headcounts are around 35 to 50 percent. In the same figure, the countries plotted using the green color, can expect that a continuation of growth will increase the impact of growth on extreme poverty reduction – as the poverty line is to the right of the mode of their country’s income distribution. In contrast, countries plotted using the blue color will face a declining impact of continued growth on their extreme poverty headcount as the statistical mode of a country’s income distribution is to the right of the poverty line.
Figure 2:
Source: Authors’ calculations using PovcalNet, http://iresearch.worldbank.org/PovcalNet/Index.html
To fully understand the implications of growth on the absolute number of extreme poor, it is also interesting to analyze how a growth rate of 1 percent reduces the number of extreme poor in each country. Figure 3 shows the outcome of that exercise. Clearly, the largest numbers of people that would be lifted out of poverty are in populous countries like India, China, Bangladesh, Indonesia, or Nigeria. However, depending again on where the initial extreme poverty line lies, relative to the mode of the income distribution of each country, the absolute number of poor being lifted out of poverty will increase or decrease respectively with additional growth. Again, we have colored the countries green, where additional growth would increase the impact on the absolute number of extreme poor and blue if not.
Figure 3: People lifted out of poverty due to 1% growth in household consumption
Source: Authors’ calculations using PovcalNet, http://iresearch.worldbank.org/PovcalNet/Index.html
Note: For visualization purposes, only countries with more a reduction of poverty in more than 50,000 people are depicted
Of course, every approach to calculating the impact of growth on poverty has its drawbacks, including the one we describe. An important one is that we take a growth rate of 1 percent, although hardly any country grows at this rate. Another one is that income distributions change over time and what we calculate, based on 2010 cross-country data, might not be relevant for today’s discussion at a specific country level (See earlier blog posts Poverty reduction, growth, and movements in income distribution and The role of changes in income distribution ). Nevertheless, we thought that it does provide some relevant information for development experts to take into account when designing strategies to end extreme poverty at the country, regional, and/or global level. In particular, it is important to know where the extreme poverty line is relative to the country’s mode of the income distribution as it has implications for the importance of growth in reducing extreme poverty.


Join the Conversation