 View of Kathmandu capital of Nepal. | © shutterstock.com
Air pollution is a global concern, with low- and middle-income countries (LMICs) experiencing significantly higher levels of ambient air pollution compared to wealthy countries. However, within LMICs, the question arises: who is most exposed to ambient air pollution around the world? Our blog explores the complexities of air pollution exposure within LMICs, highlighting the differences from wealthier countries and the role of urbanization and economic opportunity.
Examining Exposure Patterns
When measuring exposure as country-level averages, the answer is obvious: low- and middle-income countries (LMICs) experience dramatically more ambient air pollution than wealthy countries. Average ambient particulate pollution levels in many LMICs are an order of magnitude larger than the averages experienced by wealthy countries.
But within these countries who experiences the highest levels of ambient air pollution? In wealthy countries this question has been examined extensively. The conclusive result of this examination is that racial and ethnic minorities, as well as low-income populations, are the most exposed to ambient air pollution. But does that same result hold in LMICs?
There are reasons to believe that patterns of exposure may differ in LMICs compared to wealthy countries. Patterns of urbanization vary across these two groups of countries as do sources of pollution. The geography of economic opportunity may also differ in ways that drive settlement patterns, and thus exposure patterns, to differ.
Data Challenges and Innovative Approaches
There has been little evidence to-date that examines the relationship between wealth and ambient air pollution in LMICs in part because of data challenges. No LMIC has a pollution monitoring network that provides the same temporal and spatial coverage as what is available for many wealthy countries. Nor do many have the comprehensive economic census data that would facilitate systematic, population-wide examination of the relationship between wealth and pollution exposure.
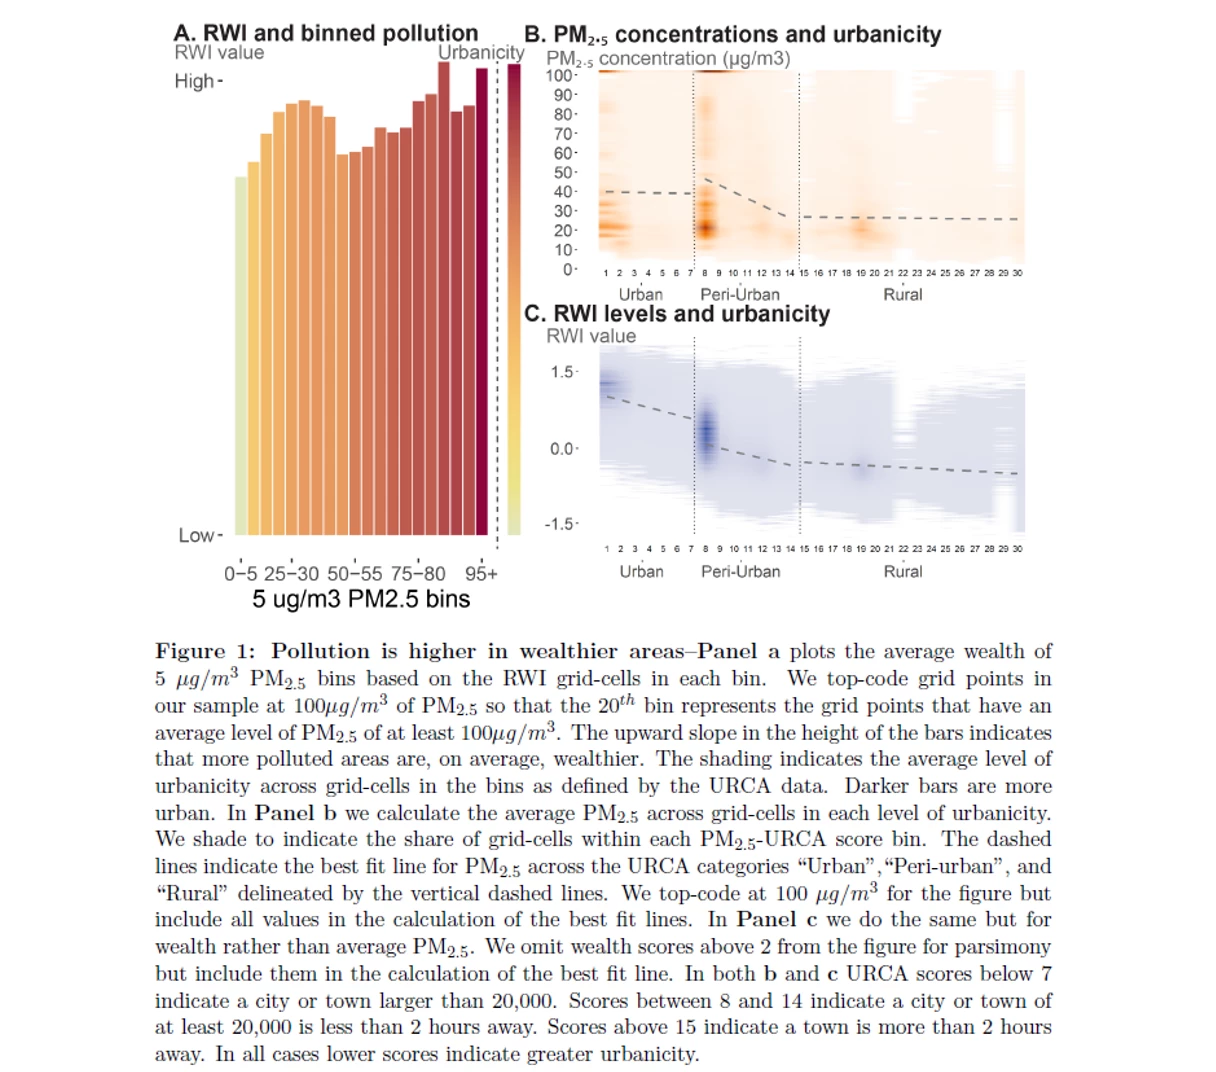
To overcome these challenges in a new paper we combine two (relatively) new sources of satellite data. One that measures ambient particulate pollution levels on a 1km grid for nearly the whole world. And a second that predicts wealth based on a machine learning approach on a 2.5km grid for more than 100 LMICs around the world. These data sets allow us to examine the correlation between ambient pollution levels and wealth at a grid-cell level in more than 100 LMICs.
Surprising Findings
Contrary to expectations based on wealthy countries, the study reveals a positive correlation between wealth and ambient pollution levels in LMICs. On average, areas with higher average wealth experience higher average levels of ambient particulate pollution. This unexpected result suggests that cities play a significant role, as both pollution and wealth tend to be higher in urbanized areas. The difference between urban and non-urban areas may be more pronounced in LMICs.
Regional Heterogeneity
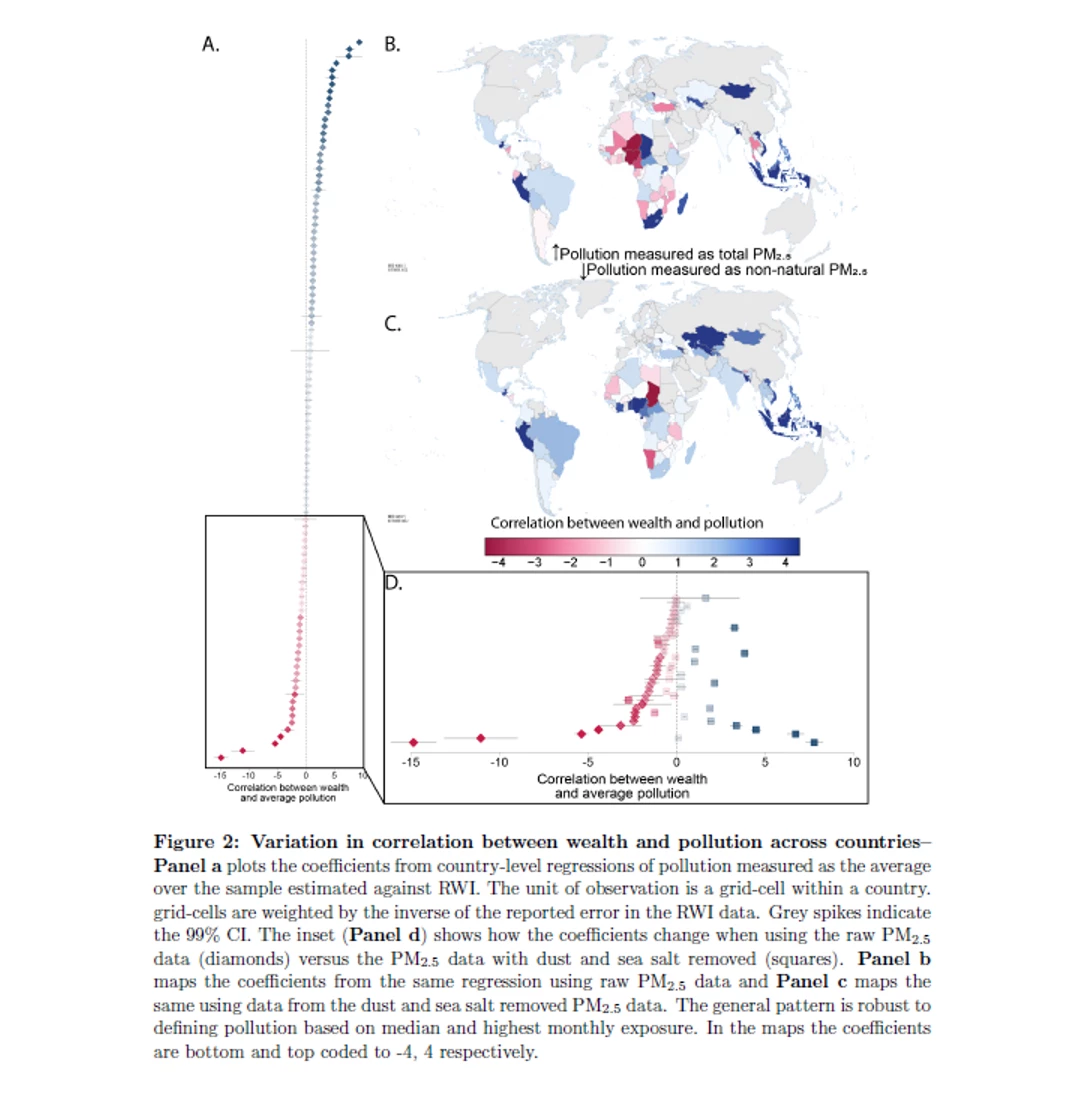
While the global average relationship shows this positive correlation, there is substantial regional heterogeneity. Some countries exhibit a positive relationship between pollution and wealth, while others show little or no relationship, or even a negative relationship — in these countries the less wealthy tend to live in more polluted areas. A key determinant of the different correlations across countries is whether pollution is predominantly generated by human activities or natural sources.
City-Level Analysis
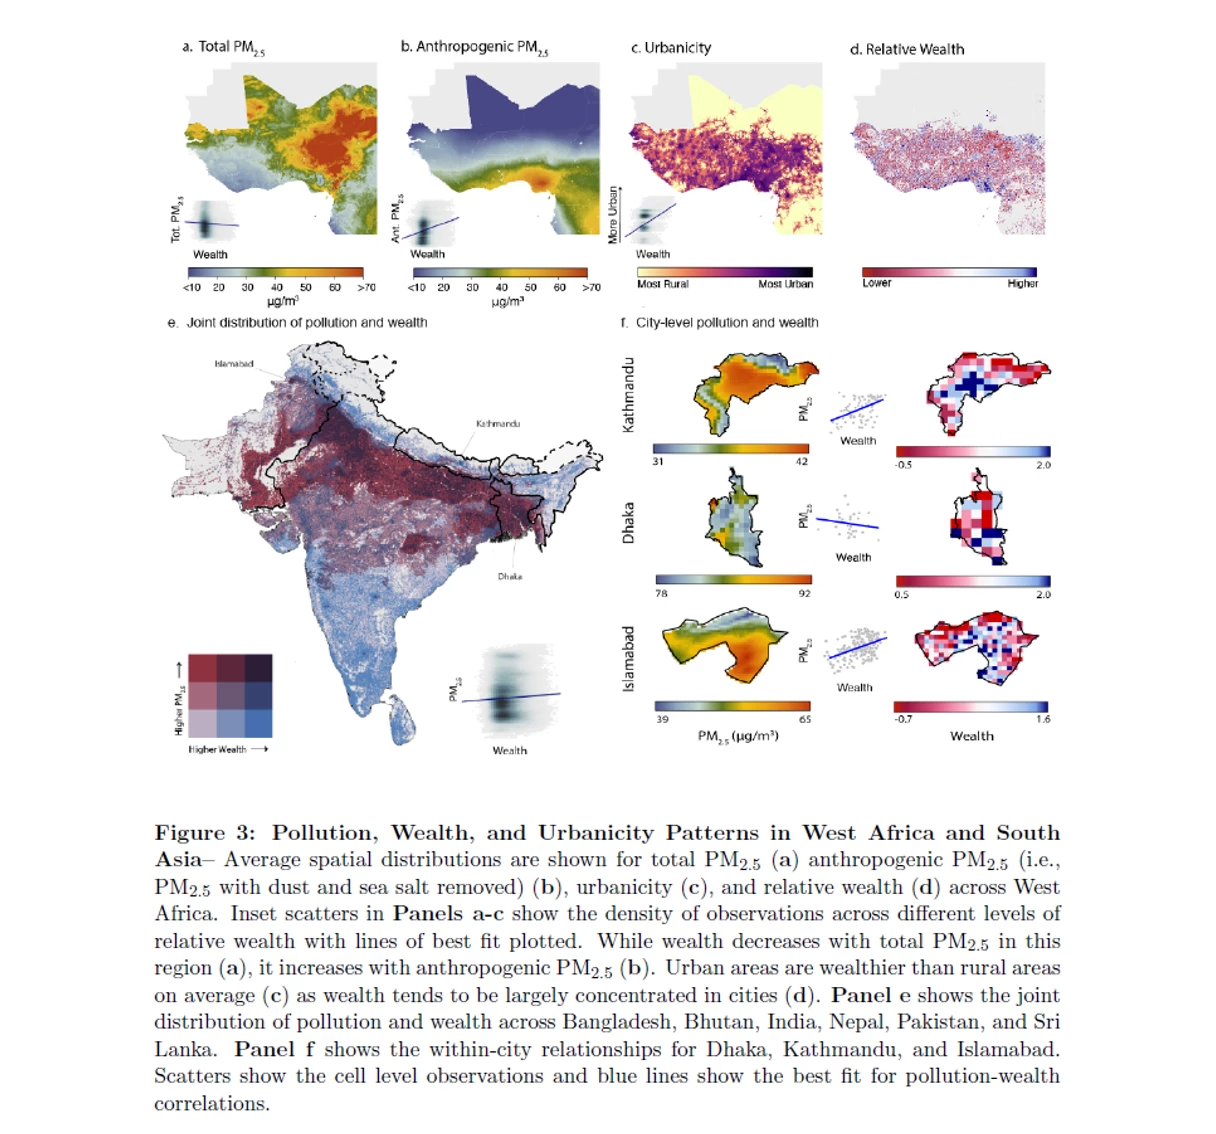
Zooming in on individual cities, the analysis reveals further heterogeneity. In some cities, the wealthy tend to reside in highly polluted areas, Kathmandu for example, while in others the relationship is the opposite (Dhaka). In still others we observe no meaningful relationship.
The factors driving these differences remain unclear, as the study does not find strong evidence for specific variables explaining city-level heterogeneity. However, evidence suggests that cities with concentrated economic activity may have more positive relationships between pollution and wealth, indicating individuals' willingness to tolerate pollution for economic opportunities.
Directions of Future Research
While the study cannot demonstrate the hypothesis that our city level results are driven by a willingness to tolerate pollution for access to opportunity, it offers a promising direction for future research. Overall, our results highlight that the wealthy in LMICs are relatively more exposed to pollution than extrapolated relationships from wealthy countries would suggest. Moreover, it emphasizes that air pollution in LMICs is predominantly an urban problem, affecting the most economically dynamic populations of these countries.
Conclusion
Understanding air pollution exposure in LMICs requires considering the complexities of urbanization, economic opportunity, and pollution sources. The findings challenge previous assumptions and call for further research to uncover the factors driving exposure patterns at the city level. By shedding light on these issues, we can develop targeted strategies to mitigate the harmful effects of air pollution and protect the health of vulnerable populations in LMICs.


Join the Conversation