An organization with ‘motor company’ in its name might produce several types of vehicle (cars, trucks, etc.) in several variations (models) at several different plants, and might sell these vehicles in several different regions of the world. The company wouldn’t last long if it didn’t know how many of each model – and at what cost – it was producing in each plant, and how many – and at what price – it was selling in each region. In the World Bank – where we like to think of ourselves as the ‘knowledge bank’ – we produce several types of document in several vice presidencies (VPUs) and we make them available in hard copy and in electronic format in all regions of the world. Yet as far as I know we don’t systematically track how many of each document type each VPU produces, let alone how successful each is in terms of sales and downloads. We have these data for World Bank books, but they’re a small fraction of our overall document output.
The lack of data ought to make it hard to think about how the institution might do things differently in its knowledge work to serve developing countries better. What type of Bank documents are produced most? And which are used most? Which VPUs are the big producers of knowledge? Which document types are downloaded most? Which VPUs produce the most downloaded documents?
In this post I’m going to take the documents in the Bank’s Documents and Reports (D&R) database, map them to VPUs, and look at document counts and downloads by document type and VPU. I’m just going to present the facts: I’m not actually sure the data below by themselves allow us to draw sensible inferences – they’d need to be combined with other data, not least data on costs, before inferences could be drawn.
The small print
Two caveats before we start. First, D&R is large (it covers about 130,000 documents) but it doesn’t include all Bank documents. Some are not in D&R because they’re not public, but D&R may also miss some that are public and downloadable. I don’t have a sense of how many documents we’re talking about. There’s a table at the end that will help Bank staff figure out which documents are included and excluded. Second, a document could be in D&R but also available for download elsewhere on the Bank’s web. As I showed in my last post, less than 10% of the Bank’s 10,000 most downloaded files and less than 10% of the 200 most downloaded ‘knowledge products’ were downloaded from D&R. Many of the top-200 knowledge products are in fact in D&R, including briefs, policy notes, etc. It’s just they’re also on other sites, and it’s there that people are mostly downloading them from. Because of the way the Bank’s systems are designed, aggregating download statistics across different sites seems like it would hard to do without a lot manual input. So, in what follows I focus on download statistics from D&R – keep in mind, they’ll understate the true download figures, especially for the flagship series that we know are heavily downloaded. I’m going to focus on documents added after November 1, 2007 and on downloads of these documents over the period 11/1/2007-11/14/2011.
How are Bank ‘knowledge’ documents distributed across document types and VPUs?
Documents in D&R are broken down into five types. These include (full breakdown appears at the end of this blog post):
(1) board documents (the commonest types being “minutes” and “board report”);
(2) country focus (the commonest types being “country assistance strategy document” and “poverty reduction strategy paper”);
(3) economic and sector work (ESW) (the commonest types being “policy note” and “public expenditure review”);
(4) project documents (the commonest types being “implementation status and results report”, “procurement plan”, “environmental assessment”, and “project information document”); and
(5) publications and research (the commonest types being “policy research working paper”, “working paper”, “newsletter”, and “brief”).
I focus on (2)-(5) in what follows – all could legitimately be thought of as knowledge outputs, though it is probably types (3) and (5) that are most often thought of as such.
Documents in D&R have an ‘owning unit’. In a lot of cases this will be the same unit that produced or commissioned the work, but this isn’t always the case: the Development Economics (DEC) VPU, for example, publishes the policy research working paper (PRWP) series, and around 50% of these are authored by Bank staff from other Bank vice presidencies (VPUs).
Table 1 shows the distribution for the period November 1, 2007 to November 14, 2011 of document types broken down across the principal owning VPUs (see note to the table for an explanation of the Bank’s VPUs). Project documents are the commonest document type, and most are produced by the regional VPUs (SDN is unusual among the networks). The number of ‘publications and research’ documents far exceed ESW documents, with most – but not all – of the latter being produced by the regions; Africa produces the largest share of ESW. The regions as a whole produce as much as 40% of ‘publications and research’ documents; the anchor VPU figure is just half that of the regional total, with two thirds of the anchor total coming from HDN and SDN. DEC’s 40% share of ‘publications and research’ documents is actually an overestimate because as previously mentioned around 50% of the policy research working papers, which account for around half the total, are authored by non-DEC staff.
What type of and whose ‘knowledge’ documents are downloaded most?
Table 2 shows average downloads per document for the same period for each document type for each VPU (categories with fewer than 10 publications have been omitted). The ‘country focus’ documents have the highest download rate, followed by ESW, followed by ‘publications and research’. While there is relatively little variation across VPUs in download rates for ESW, and also quite a small variation for ‘country focus’ documents, there is a large variation across VPUs in download rates for ‘publications and research’ documents. The regions all have higher download rates for ‘publications and research’ than the network anchors: in fact, the network anchor with the highest download rate – PRM – has a lower download rate than the regional VPU with the lowest download rate (AFR). DEC’s high mean of 175 is probably an underestimate because its flagships are among the most downloaded documents in the Bank, but the downloads occur mostly from the flagship websites and these downloads are excluded in the figures in Table 2. There may be some bias – which could go either way – on the PRWPs only half of which really belong to DEC. IEG has the lowest download rate of all VPUs for the ‘publications and research’ category.
Shouldn’t the numbers be normalized?
High output numbers and download rates may reflect a lot of countries to cover, or a lot of staff, or both. Africa, for example, has six times as many countries in it as S Asia. The SDN anchor has three times as many staff as the HDN anchor, and DEC has almost twice as many staff as the PRM anchor. Some might argue that normalizing the totals by countries and staff numbers would give a fairer comparison. I’m not sure about this. It’s not obvious we would want to see similar publication rates across countries – some countries might benefit more from a multicountry study than a country-specific study. And normalizing by staff numbers makes the tables seem like a productivity exercise, and an incomplete one at that, because staff has other commitments beyond their knowledge work, and units vary in the share of staff time spent on knowledge work.
Still, for what it’s worth Table 3 combines the two document types that are probably most often thought of as knowledge outputs – ESW and ‘publications and research’ – and reports for each VPU and for both the total number of documents and the total number of downloads the unadjusted total, the total per country, and the total per staff member. Data on staff numbers per VPU were calculated from the 2010 staff directory and include HQ and field-based staff.
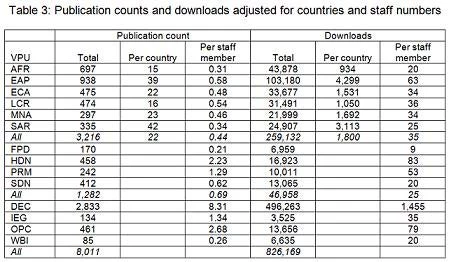
East Asia comes out ahead of the other regions on unadjusted and ‘per staff member’ publications and downloads, but slips behind S Asia on the ‘per country’ figure. Africa slips from 2nd position on the unadjusted figures to 6th position on the two adjusted figures. Latin America comes up to 2nd position on the ‘per staff member’ figures. On a ‘per staff member’ basis, the network anchors as a group produce more knowledge output than the regions, though their ‘per staff member’ download figures are lower. There is considerable variation across network anchors, and some shuffling of rankings once staff numbers are taken into account, with PRM’s position improving and SDN’s worsening reflecting the fact the latter is much larger than the former. DEC’s publication count per staff member is an overestimate given 50% of working papers are authored by non-DEC staff. Whether the DEC download ‘per staff member’ is an over- or underestimate is less clear: on the one hand, the figures credit DEC with downloads that really belong to other units; on the other hand, the download figures understate the true downloads because most flagship downloads are from the flagship websites.
Annex Table: Documents in D&R by document type, Nov 2007-Nov 2011

Join the Conversation