Africa’s population grew at an average annual rate of 2.6 percent between 1950 and 2014, much faster than the global average of 1.7 percent as estimated from UN population projection data. During this time, the region experienced a demographic transition, moving from a period of high mortality and fertility rates to one of lower mortality, yet still high fertility rates. Other regions, most notably East Asia, took advantage of their transitions to accelerate growth, and reap a so-called ‘demographic dividend’. Africa is now being presented a similar opportunity.
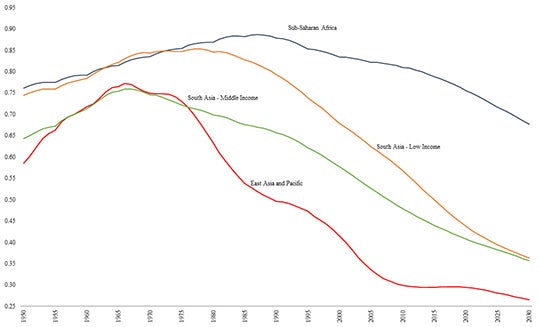
To get a sense of how demographics in Africa might be changing, let us take a look at the region’s total dependency ratio (TDR), a powerful summary of the age structure, and essentially the ratio of the total number of elderly and youth to the working age population (15-64 year olds). In the chart below, Africa’s TDR is compared to non-high income East Asia’s and South Asia’s. Africa’s dependency ratio peaked later and higher than the other regions’, and the changes have been much slower. As a colleague noted last summer, Africa’s window to reap the benefits of demographic transition would appear to still be open for a couple of decades. This opportunity will not last forever and the region will need to take action to convert these changes into a demographic dividend.
In a recent paper, my colleagues and I try to get a handle on how much the demographic dividend could contribute to Africa’s future growth and poverty reduction. We use an economic simulation framework to consider a range of future scenarios under different economic and demographic assumptions. For example, declining dependency ratios can affect the simulated economies in a range of ways but two of the main mechanisms might be the most intuitive. First is through the labor supply effect, with the number of workers per capita rising as the working-age share of the population increases, assuming no changes in the labor force participation or unemployment rates. Second is through savings and investment. The literature suggests that economies with low dependency ratios have higher savings and, thus, potentially more investment. This reflects the idea that retirees and young children typically do not save a lot compared to those who are working.
We find that demographics could account for 11 to 15 percent of GDP growth in the region between 2011 and 2030--varying by country. The potential contributions to poverty reduction could also be substantial. In 2007, Africa’s poverty rate was about 52 percent – measured at the $1.25 a day poverty line. By 2030, this rate could reduce to 17.1 to 36.7 percent (210 to 451 million poor). In either case, the boost in growth from demographic change could account for 40 to 60 million less poor.
The impact of demographic change could be even greater when combined with investments in areas like education. Even with unchanging educational attainment rates, Africa would experience an increase in skilled labor, leading to up to a 2 percent improvement in GDP in 2030. However, in a scenario where educational attainment is assumed to improve, such that the skill share of Africa’s labor supply doubles by 2030, Africa’s poverty rate could be as low as 13 percent.
Our scenario analysis shows that the demographic dividend could be potentially large, but it can only be achieved if the burgeoning working age population can be gainfully employed and if the boost in savings can be realized and converted into investment. Meeting these two conditions is non-trivial, and will require sound policies that support education and maintain stable and supportive political and economic environments. None of these will be easy, but the payoffs can be substantial.
* Note: East Asia and Pacific is only low and middle-income countries as classified by the World Bank. Middle income South Asia is India, Pakistan, and Sri Lanka; low income South Asia is Afghanistan, Bangladesh, Bhutan, Nepal, and the Maldives.
The total dependency ratio is the ratio of the youth and elderly population to the working age population.
Source: Authors’ calculations from UN (2012)


Join the Conversation