The Country Partnership Framework (CPF) for the coming five years in Ethiopia, approved by the World Bank board in June, features a “spatial lens” for development activities. This lens was developed in a background note we wrote evaluating spatial disparities and their related challenges. In it, we looked at the policy framework put forward by the 2009 World Development Report “Reshaping Economic Geography,” and combined it with literature on pro-poor growth. Together, these have allowed us to put forward policy solutions Ethiopia could adopt to bridge spatial disparities.
In this three-part blog series, we present the key findings of our note, as well as broad, overarching policy solutions.
The guiding questions in our evaluation were: How to integrate the poorest, rural, bottom 40 percent (“Bottom 40” or “B40”) of the population in the overall growth process? How can areas of high B40 concentration be better linked to centers of economic activity?
We also looked at how to create larger urban centers, ones to which rural areas can be linked? And how to increase the capacity of these urban centers to address urban poverty?
Rapid economic growth
Ethiopia is a fast-growing economy, with double-digit growth in the past decade, and prior growth that also drastically reduced poverty from 2000 to 2011—from 55.3 to 33.5 per cent of the population (based on the poverty rate of US$1.90/day). Despite its large population of about 100 million, the country also has one of the world’s lowest rates of inequality, with a Gini coefficient of 0.3.
That said, rapid growth has not reduced inequality for the very poorest.
For instance, the Systematic Country Diagnostic (SCD) showed that the poorest 10 percent of the population experienced a decline in consumption, implying that reductions in overall poverty rates were not matched by reductions in its depth and severity among all those experiencing it.
For analysis on this, we conducted geo-mapping exercises, and verified findings against data available for Ethiopia.
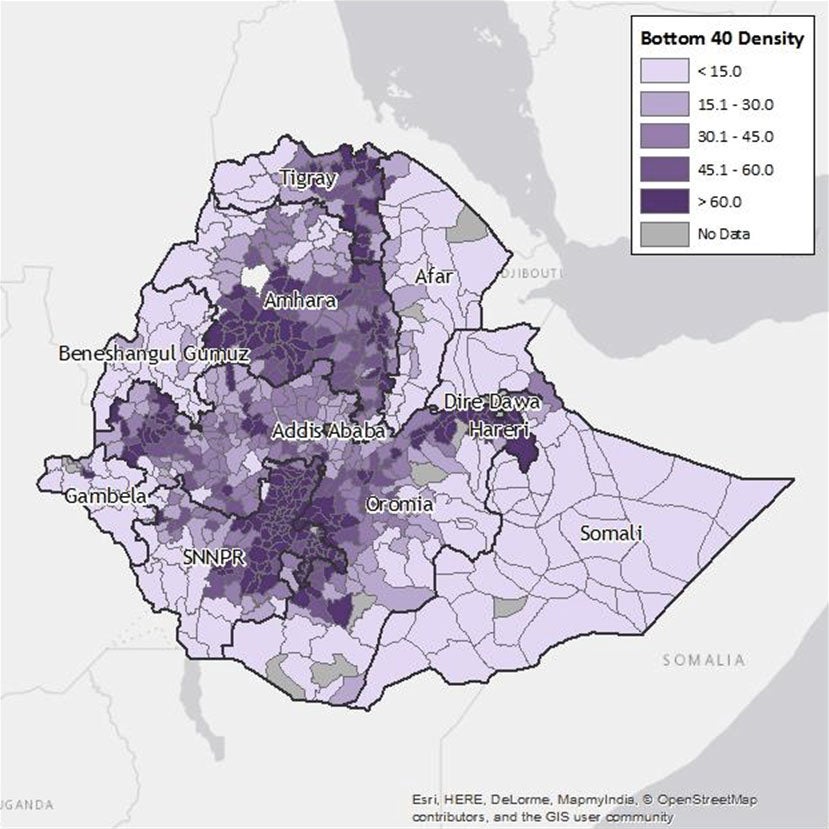
First, figures 1a and b illustrate the distribution and the density of the Bottom 40 across Ethiopia at the woreda (district) level, where we see that there exist both inter- and intra-regional disparities in poverty and human welfare indicators, confirming the geographic unevenness of progress. Figure 1 shows that within regions some woredas are poorer than others.
Figure 1: Spatial distribution of poverty and malnutrition
a) Distribution of the bottom 40 percent

b) Density of the bottom 40 percent

The density of the B40 mirrors population density, and shows that there exist deeper pockets of poverty in areas of dense population. At regional level, regions that are constitutionally denominated as historically underserved (Somali, Afar, Gambela, and Benishangul-Gumuz) also see variations, with some being worse off—such as Afar in the north-east and Somali in the south-east of Ethiopia—on multidimensional poverty indicators, while others perform better than the national average, such as Gambela in the south-west. Malnutrition rates also display similar patterns (Figure 1c).
Figure 1c: Malnutrition in Ethiopia: distribution of stunted children

In contrast to this, deep pockets of poverty also exist within regions that are not considered historically underserved.
The 2009 World Development Report asserts that even if economic growth is concentrated in specific parts of a country (and can therefore be unequal), development can be inclusive if, among other things, the economic distance between the poor and the thriving parts of the nation can be reduced, and if welfare policies ensure the convergence of basic living standards for everyone.
In Ethiopia, the expansion of basic services in all areas has been achieved, helping bridge development gaps and making significant progress in terms of poverty reduction, with regions with the highest poverty rates seeing more rapid progress.
Literature on pro-poor growth dictates that economic growth is a necessary but not a sufficient condition for reducing poverty and inequality. The real impact economic growth has on these also depends on the sectoral composition of growth. Labor-intensive sectors like agriculture and light manufacturing, for example, have a greater impact on poverty reduction than less labor-intensive sectors.
To get a better understanding of where economic concentration lies in Ethiopia, and how cities are growing, in Part II of our blog we look at six key, secondary cities, and the changes they have seen in road density over the ten years between 2006 and 2016.
We also look at changes in nightlights (or lights at night-time, indicating the use of electricity at night) in the four years between 2012 and 2016.
Data provided by DEC survey unit. Maps produced by the Data Management Unit.


Join the Conversation