 Plants on coins illustrating green finance concept | © shutterstock.com
In this year’s Assessment Report, the Intergovernmental Panel on Climate Change finds that human influence unequivocally has warmed the Earth. What seems to be getting heated as much as our atmosphere is investors’ interest in environmental, social, and governance (ESG) investing. Morningstar reports that investors poured $185.3 billion into ESG funds during the first quarter of 2021, bringing total assets harbored by such funds to nearly $2 trillion.1
While many ESG investors are drawn by the enticing returns of such funds in recent years, it should be noted that neither theory nor practice indicates that those higher returns will last. As is often pointed out by academics and practitioners, whether ESG investing becomes impactful hinges on whether it produces lower expected returns — i.e., higher current valuation — for ESG-competent firms. Because one investor’s lower return is another firm’s lower cost of financing, ESG investing aims to provide cheaper financing to ESG-competent firms and to encourage ESG-laggards to improve to achieve higher valuations. While ESG investing aims to address a broad scope of sustainable corporate practices, this blog and the project it discusses are focused specifically on the “E” of ESG investing — green investing.
Once we establish that the goal of green investing is to create enough price pressure that pushes up the valuation of greener firms while pushing down the valuation of polluting firms, we should next ask the following questions: How much pressure is each firm facing? Which investor is exerting the most pressure? Does this price pressure nudge managers to adopt eco-friendly business practices? For convenience, let us define “institutional pressure” as the price pressure generated by institutional investors’ preference for greener stocks.
On the firm side, a simple way to gauge this pressure would be looking at a given firm’s amount of institutional ownership, that is, what percentage of outstanding shares are held by institutional investors. An obvious problem of this approach is that it treats all institutional investors the same while not all of them may prefer green stocks — picture a hedge fund actively seeking undervalued oil stocks. On the investor side, a simple way to measure the pressure exerted would be to measure the average “greenness” of the investor’s portfolio. This presumes that an investor who allocates a large portion of its portfolio to greener stocks does so because it prefers green stocks and thus would be exerting a large institutional pressure. However, this approach ignores other firm characteristics. One example is firm size: in the data, large firms tend to appear greener, as proxied by third-party environmental scores (we use Sustainalytics’ E-scores in our project), perhaps because they are more resourceful. Because of this empirical relationship, an investor who prefers large-cap stocks will be considered “green” under this simple measure. This is in the same vein as a popular criticism of ESG exchange traded funds (ETFs): many of them are indistinguishable from large-cap tech ETFs.
In our project, we attempt to develop a measure of institutional pressure that resolves these concerns by adapting the demand system asset pricing framework developed by Ralph Koijen and Motohiro Yogo.2 Our procedure is as follows: (1) on the investor side, we estimate each institutional investor’s distinct demand, or preference, for greenness; (2) on the firm side, we take the estimated preferences of its institutional owners and take the ownership-weighted average of these preferences to compute the pressure that a given firm faces. The two-step description is not technically precise but conceptually captures the procedure well.
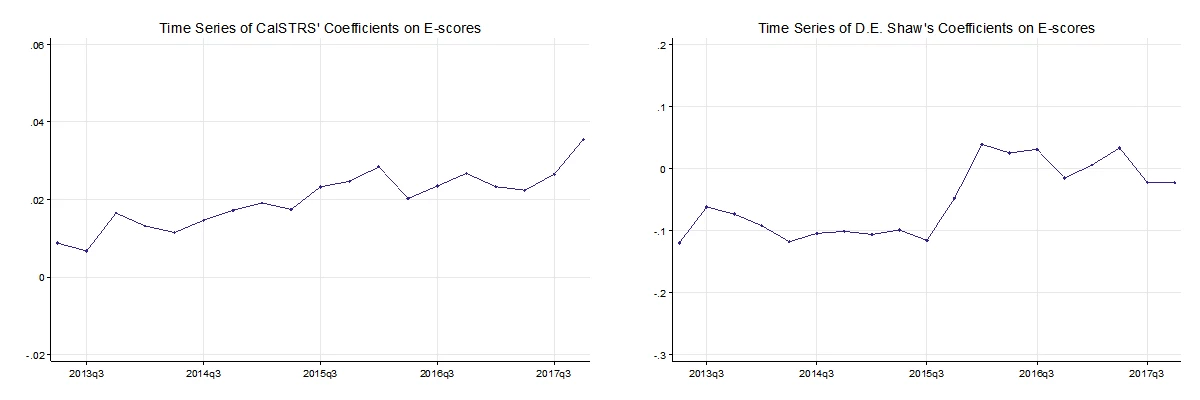
The first step involves running a nonlinear regression for each institutional investor’s snapshot of stock holdings provided in the 13F filings. Each observation in this regression is a stock in the investor’s investment universe, where the dependent variable is the portfolio weight allocated to that stock and the independent variables are the stock’s characteristics, price, and an instrument for the price. If an investor over-weights, or prefers, stocks with high environmental scores even after controlling for other characteristics, the coefficient on e-score in this regression will be positive. Because other characteristics, such as firm size, enter this regression, we take care of the second problem discussed in the previous paragraph. From this exercise, we indeed find that investors demonstrate significantly heterogeneous fondness for greenness — that is, different coefficients — in the cross-section and in the time-series. Look at the following two examples of CalSTRS and D. E. Shaw: CalSTRS has a positive and increasing coefficient while D. E. Shaw starts off with a negative coefficient (figure 1).
Figure 1. CalSTRS’ and D. E. Shaw’s Coefficients on E-Score

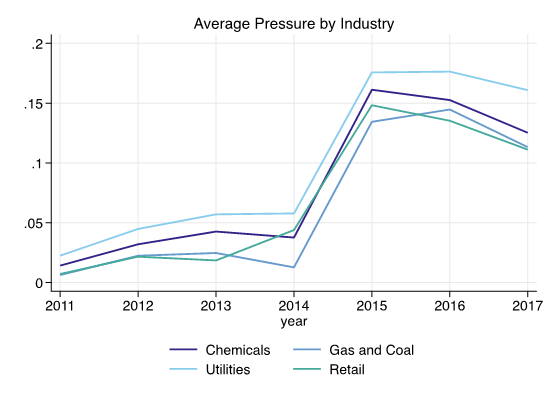
In the second step, we take an ownership-weighted average of the owners’ coefficients for each firm. To be precise, the expression for institutional pressure is derived by implicitly differentiating the market clearing equation with respect to price. Therefore, the exact expression also requires an additional weight adjustment that de-emphasizes price-elastic owners. The intuition is that if all your owners are price-elastic, a small price decrease is enough to keep them just as happy even if you become less green. Aside from this technicality, the firm-level institutional pressure we derive is essentially a weighted average of the previously estimated coefficients. Figure 2 shows the average pressure for chosen industries. We see that institutional pressure has increased overall around the Paris Agreement of 2016, but not necessarily more so for polluting industries.
Figure 2. Average Pressure by Industry

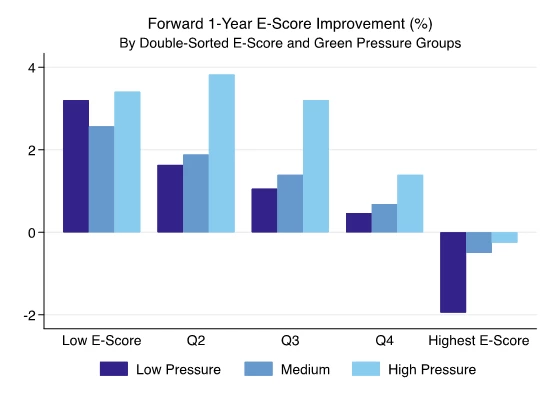
Given this firm-level institutional pressure, a natural next step is to check whether it predicts a firm’s improvement in environmental performance. To some degree more institutional pressure predicts greater improvement in the environmental score, as shown in figure 3. Firms in the high-pressure group experience either larger improvements in environmental scores, or less deterioration in environmental scores (decrease at the top happens due to some mean reversion). However, institutional pressure does not seem to predict future decreases in reported scope 1 and scope 2 emissions. Thus, we find a somewhat cynical result where more institutional pressure seems to predict improved scores, but not less emissions.
Figure 3. Forward 1-Year E-Score Improvement (%) by
Double-Sorted E-Score and Green Pressure Groups

Source: Jihong Song (Princeton University)
There remain some caveats with these results, although we believe that the procedure itself may come in handy for many purposes. The first caveat concerns the quality of third-party environmental scores as a proxy for actual greenness. A well-studied problem of such scores is that different raters disagree significantly among themselves, sometimes demonstrating a correlation as low as 0.4 — compared with a 0.99 correlation in credit ratings.3 The second potential concern is that we only consider price pressure and thus conveniently assume that green investors will overweight greener stocks. However, a green activist investor may do exactly the opposite and purchase polluting firms to improve their environmental performance. While this aspect is missing in our current approach, we believe that our suggested approach provides a rigorous attempt at measuring institutional price pressure, which may also be applied to other stock characteristics — replacing “greener” by “larger” or “higher dividend-yielding” for instance.
So, all things considered, are firms feeling the heat? Not as much as many would hope, it seems.
References
1. Koijen, R. S., & Yogo, M. (2019). A demand system approach to asset pricing. Journal of Political Economy, 127(4), 1475–1515.
2. Berg, F., Koelbel, J. F., & Rigobon, R. (2019). Aggregate confusion: The divergence of ESG ratings. MIT Sloan School of Management.


Join the Conversation