 African American professional extending hand for handshake | © shutterstock.com
To obtain loans in most consumer credit markets, households interact with loan officers. The discretion allowed to loan officers may significantly affect households' credit access. For example, both the U.S. Department of Justice and the Federal Trade Commission have filed enforcement actions against the abuse of loan officer pricing discretion. The newly issued loan originator compensation rules under Regulation Z impose restrictions on payments of compensation to loan originators to address concerns about their lending practices. Meanwhile, artificial intelligence modeling has been developed to eliminate human biases and has been widely adopted in the U.S. consumer credit market (figure 1). Despite the extensive debate on these issues, there is limited research on loan officers' discretion and how the use of a machine changes the role of loan officers in determining credit outcomes.
In our recent working paper, we answer these questions by taking advantage of a new disclosure requirement after the financial crisis. The Dodd-Frank Act requires individual loan officers to be licensed or registered with the Nationwide Licensing System and Registry (NMLSR). We obtained individual loan officer registration records from NMLS Consumer Access and infer the race of each loan officer using both the surname and the first name. We then merge loan officer race data with each individual loan application record for which the loan officer is primarily responsible. This merged data set provides, for the first time, loan-level mortgage application records linked to each registered mortgage loan officer in the United States.

Figure 1: Regional Distribution of Automated Underwriting System (AUS). The AUS adoption is measured by the share of loan applications that went through an AUS out of the total loan applications submitted from borrowers in a county. Data source: 2019 Home Mortgage Disclosure Act (HMDA).
With this novel data set, we document a significant underrepresentation of minority mortgage loan officers, which is common across financial institutions, especially in small banks and shadow banks (figure 2). The minority loan officer share turns out to be negatively associated with the well-documented racial mortgage rejection gap in the United States (figure 3). The adoption of algorithmic underwriting exhibits a similar negative correlation with the racial gap in mortgage approval and weakens the association between the share of minority loan officers and the racial gap (figure 4). These aggregate facts seem to suggest that increasing the presence of minority loan officers could improve credit access for minority borrowers, but the development of financial technology may help achieve the same purpose .
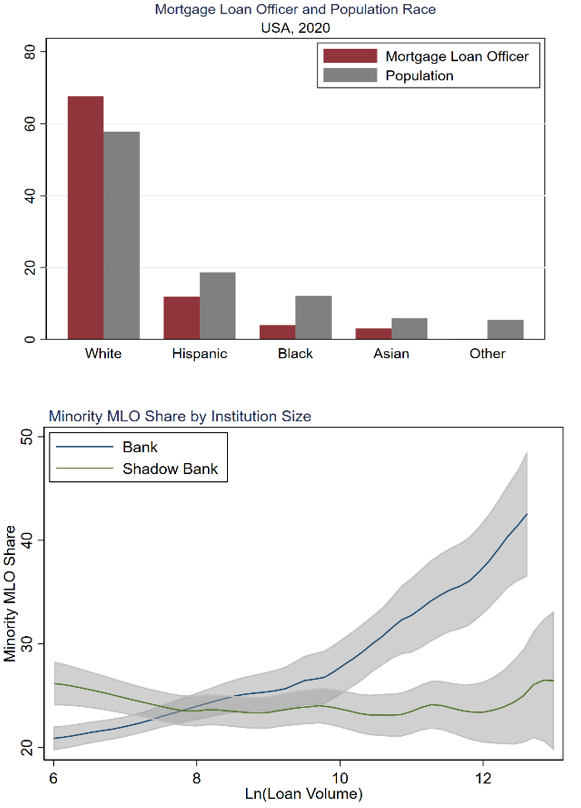
Figure 2: Mortgage Loan Officer by Race and Minority Loan Officer Share across Financial Institutions. The top panel plots the race distribution of registered mortgage loan officers in the US. The red bars are loan officer race, and the gray bars are the population race. Both are based on statistics in 2020. The bottom panel plots the distribution of share of minority (non-White) mortgage loan officers across financial institutions. To find the share of minority mortgage loan officers, we divide the number of non-white loan officers by the total number of registered mortgage loan officers in each financial institution. Data sources: MLO registration data, HMDA, and Census.
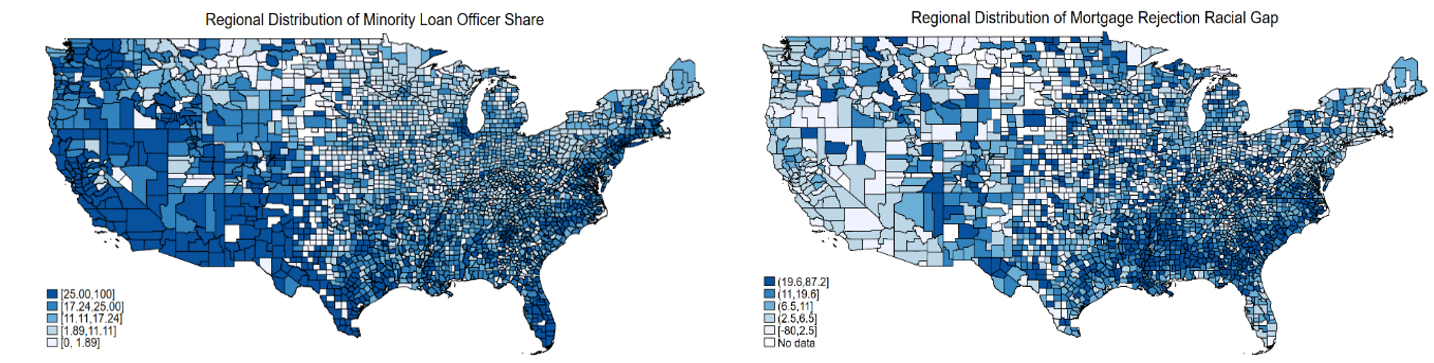
Figure 3: Regional Distribution of Minority Loan Officers and Mortgage Rejection Gap. This figure plots the regional heterogeneity of share of minority mortgage loan officers (Left) and mortgage rejection gap in 2019 (Right). To find the share of minority mortgage loan officers, we divide the number of non-white loan officers by the total number of registered mortgage loan officers in each county. Mortgage rejection gap is defined as the difference in the average rejection rate residuals between white and non-white borrowers. To get average rejection rate residuals, we first regress loan approval status of individual loan applications on loan purpose, loan type, borrower income, borrower age, LTV, DTI, lender-year fixed effects, and county-year fixed effects; we then find the residual average of each borrower race. Data sources: MLO registration data and HMDA.

Figrue 4: Use of AUS, Minority Loan Officer, and Racial gap. This figure plots the county-level association between local AUS adoption rate and the mortgage rejection gap (Left) and the institution-level association between racial mortgage rejection gap at and minority loan officer share by institution type (Right). The left panel shows the binned scatterplot and the fitted line of county-level residualized rejection gap against county-level minority loan officer share. The right panel shows the binned scatterplot and the fitted line of institution-level residualized rejection gap against institution-level minority loan officer share. We remove small institutions that originate fewer than 400 loans in a given year. The red line indicates institutions with above-median usage of AUS, and the gray line indicates institutions with below-median usage of AUS. Data sources: MLO registration data and HMDA.
At the micro-level, we find strong evidence for loan officer discretion in credit decisions: loan officer fixed effects significantly contribute to explaining both mortgage rejection likelihood and the interest rates of approved loans after controlling for a saturated set of borrower and loan characteristics and any differences across counties, months, and lenders. For both mortgage outcomes, F-tests reject the null hypothesis that the coefficient estimates of loan officer fixed effects are jointly zero.
Moreover, racial proximity influences loan officers' discretion in making loan approval decisions—minority loan applicants are 1.6% less likely to be rejected if their applications are handled by a minority loan officer than by a white loan officer . This reduction in rejection likelihood is most significant for Asian and Hispanic borrowers: Asian (Hispanic) borrowers are 4.2% (1.8%) less likely to be rejected if handled by a loan officer of the same race than by a white loan officer. The effect of racial proximity is more pronounced for lower-income borrowers.
Racial proximity increases the total loan volume provided to the same race borrowers. Within the same county and lending institution, minority loan officers originate 23.1% more loans to minority borrowers than do white loan officers over a half-year span. In addition to total volume, loan size dispersion is another important dimension to examine as the shortage of small mortgages has been a rising concern in many communities across the nation. We find that loans originated to minority borrowers from minority loan officers are more dispersed in size compared with those from white loan officers. On average, the loan size is 5.6% and 2.1% smaller at the 5th and 10th percentiles, respectively, but 4.1% and 5.8% larger at the 90th and 95th percentiles, respectively.
Lastly, FinTech has been widely adopted in U.S. consumer credit markets. Automated underwriting systems (AUS) are one of the most popular technologies in the mortgage origination market and are promoted by many government loan programs. We find that the use of AUS improves loan origination from white loan officers to minority borrowers but weakens the extent to which minority borrowers benefit from having a minority loan officer. Since the number of white loan officers undoubtedly dominates the number of loan officers from other racial groups, these findings appear to be consistent with the negative relationship between the use of algorithmic underwriting and the rejection gap at the aggregate level—with the adoption of AUS, minority borrowers’ credit access is improved through white loan officers more than it is reduced through minority loan officers.
Our findings have a number of policy implications. Our results on racial proximity improving loan outcomes suggest that the observed discrimination in mortgage origination data can be driven by the underrepresentation of minority loan officers, which makes minority borrowers less likely to find a same race loan officer than white borrowers. Therefore, we provide empirical support for policies that aim to improve minorities’ presence in the labor market of loan officers. Our results also indicate that the use of a machine in mortgage underwriting could serve as an alternative solution to alleviating the cost of underrepresentation of minority loan officers.


Join the Conversation