 Woman holding a child following the damage aftermath of cyclonic storm FANI hitting Puri Odisha, India. © shutterstock.com
Debt markets in India have witnessed a series of event-based shocks in recent years, and borrowers at the bottom of the pyramid are particularly vulnerable to such shocks. Northern Arc, an India-based impact debt platform, has a large repository of loan data spanning over a decade, with around 200 live pools of securitizations, resulting in millions of repayment observations every month. This is anchored on Nimbus, an in-house technology platform. The data enable a dynamic understanding of credit behavior over time across geographies, originators, loan sizes, loan cycles, demographics, and credit bureau scores. This blog summarizes our findings on the aggregate performance of microfinance loans in India after events that have impacted the repayment capacity of borrowers and assesses the time taken to return to normalcy.
Base data and assumptions
We consider three events — demonetization, the Kerala floods, and cyclone Fani in Odisha. Demonetization was a nationwide event impacting all microfinance institutions. The Kerala floods and cyclone Fani were localized events severely affecting specific districts.1 The following key metrics were used to assess recovery patterns:
- Periodic collection efficiency: the percentage of demand/dues collected in a month. Although the mean collection efficiency provides a good point-in-time assessment of recovery, the volatility of collections provides insight into recovery behavior over time and is a more nuanced reflection of what happens on the ground after a shock event.
- Portfolio at risk trends (PAR 0, PAR 30 or PAR 90): the loan portfolio outstanding for 0, 30 or 90 days, measured as a proportion of the overall portfolio.
- Recovery rates: the percentages of borrowers with at least one installment paid in a month, grouped into days-past-due (dpd) buckets to differentiate the behaviors of regular and overdue customers.
Performance of microfinance institution loans post–macroeconomic shocks
For the three events, a trend analysis was conducted of the key metrics to derive insights into post-event portfolio repayment behavior. The loans in the portfolio were cherry picked using proprietary algorithms, so there could be some selection bias. However, given the size and granularity of the portfolio, long time series, and high level of diversification across originators, states, and districts, we consider it a fair representation of the behavior of the sector in India.
Event 1: Demonetization, November 2016
We considered loan data for 3.7 million customers in more than 400 districts in India (the country has 700 plus districts). The key findings are as follows:
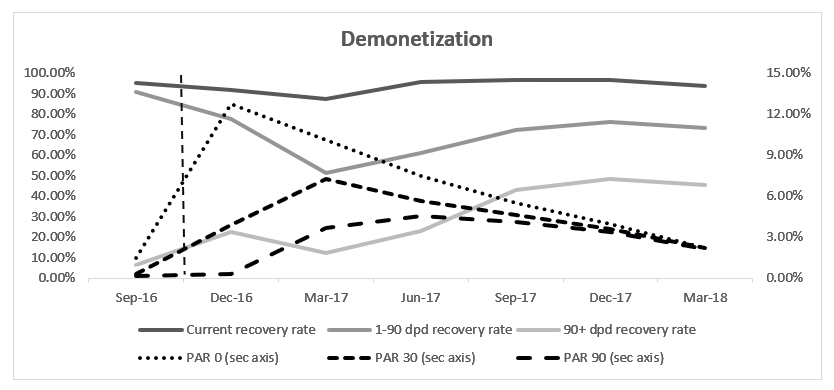
- PAR levels increased significantly immediately after demonetization, followed by a gradual reduction across all PAR buckets over four months.
- PAR 90 finally settled at ~2% by March 18.
- A sharp increase was observed in recovery rates across all buckets.
- Recovery rates increased after the event for six to nine months before flattening at a higher level.
Event 2: Kerala floods, August 2018
The devastating floods in Kerala occurred in August 2018. We considered 27,000 loans in nine impacted districts.

After the floods, we find that:
- Collection efficiency levels dropped from 96% (pre-event) to 60% in August 2018 but picked up in September.
- Volatility increased from 8% to 26% and then subsided to ~15%–20%.
- PAR 0 increased from 0.20% to 23% in August 2018 and then reduced over the subsequent months.
- There was no impact on PAR 30, as only one installment of borrowers was affected.
- Recovery rates dipped only during the event month and picked up to regular levels in the subsequent month.
- The proportion of loans in the 1–30 bucket was higher for two months after the event.
- There was no impact on buckets > 30 days past due.
Event 3: Cyclone Fani, April 2019
Cyclone Fani hit the eastern coast of India in 2019, primarily impacting Odisha, West Bengal, and Andhra Pradesh. We considered 75,000 loans in 14 districts.

Our findings reveal that:
- Periodic collection efficiency dropped from 97% to 90% immediately after the event.
- Collection efficiency levels picked up immediately and reverted to pre-event levels in about two months.
- Volatility increased from 13% to 24% and then reverted to pre-event levels in four months.
- PAR increased immediately after the event and recovered over one to two months. Due to the frequent occurrence of cyclones, coastal districts of Odisha are well adapted; hence, there was a quick recovery.
- Not much impact was observed in the current bucket recovery rates. The proportion of loans in this bucket was always greater than 99%.
- The 1–30 bucket recovery rates were impacted and recovered over a period of two to three months.
Conclusion
Given the size and granularity of the portfolio and the high level of diversification, this portfolio is a fair representation of the behavior of the microfinance sector in India over time.
Historically, although microfinance loans have been impacted immediately after a crisis, collection efficiencies have recovered quickly, even where local geographies have been severely affected. The volatility of collections provides an important insight about the process of recovery. Not all borrowers are affected equally, and repayment behavior differs across clients, geographies, and lenders until it returns to normal levels.
The post-demonetization recovery illustrates the response after a nationwide, systemic shock. Events like cyclone Fani and the Kerala floods are episodes of local crises. For borrowers operating in these areas, often their homes, livelihoods, and lives are completely disrupted. They find it difficult to pay multiple outstanding installments. Hence, improvement may not be visible in the PAR buckets even after they start repaying. However, the data show that, over time, most borrowers in the vulnerable, underbanked category fully repay their loans.
This repayment behavior through periods of shocks may provide a fresh perspective to policy makers, lenders and rating agencies on the risk attached to borrowers at the bottom of the pyramid. There may be a case for an increase in the flow of credit and a decrease in the risk premium applied to these borrowers.
____________________________________________________

Join the Conversation