Policymakers and researchers would often like to measure whether reforms have their desired effects, but it’s not always feasible to collect survey data to shed light on this issue. Here, administrative data, that is being collected in any case, can help. Administrative data has no additional cost and may be readily available, particularly in countries that digitize the information they collect.
In this post, we share an example from Georgia to illustrate how administrative data can be used to measure reform impact. In 2010, the Georgian government introduced a simplified business taxation regime. One component of this reform was that businesses with annual revenue below GEL 30,000 (US$ 18,255) and without employees are designated as “micro” businesses and are exempt from income taxation. These firms are still required to file a tax return, but they don’t have to pay income taxes. A potential effect of this reform is that firms that previously operated without registering with the tax authority might now register (or “formalize”) or also that entrepreneurs may create new micro businesses.
To measure the effect of the reform on formal firm creation, we use an administrative database with anonymized information on all firms registered with the Georgian Tax Authority. The database reports the date when a firm first registered with the tax authority and how much revenue it declared in each tax year (for 2008 through 2012).
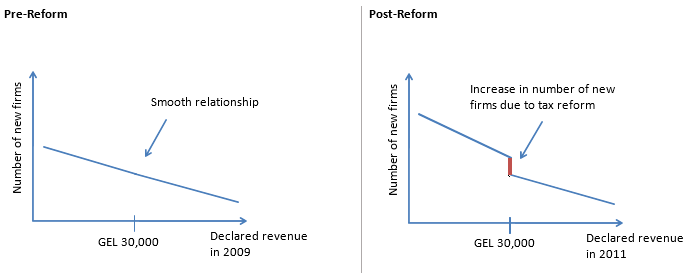
This comprehensive database allows us to rely on a regression discontinuity design to study the effect of the reform. The regression discontinuity approach compares the number of newly registered firms just below the GEL 30,000 eligibility cutoff in annual revenue to the number of newly registered firms just above the cutoff. The intuition behind this approach is that if we plot declared revenue on the x-axis and the number of newly registered firms on the y-axis, we should see a smooth relationship without jumps before the reform. If we plot the same graph with post-reform data, we expect to see a jump in the number of newly registered firms right below GEL 30,000 (as illustrated in Figure 1), indicating a positive impact of the reform on formal firm creation.
Figure 1: Illustration of regression discontinuity design (Reform impact on formal firm creation)

When we plot the actual data for 2009 and 2011 (Figure 2), we see a pattern that very much corresponds to the illustration in Figure 1. We use regression analysis to estimate the size of the jump at the GEL 30,000 cutoff in the 2011 data and find that the micro tax reform increased the number of newly registered firms below the threshold by 18 to 30 percent. When we examine the data for 2012, however, we see no jump at GEL 30,000, suggesting that the effect of the reform on formal firm creation was short-lived.
Figure 2: Administrative data on newly registered firms

A caveat of the administrative data is that it does not allow us to distinguish whether the increase in registrations comes from previously unregistered (i.e. informal) firms or from newly created firms. The dataset only captures firms once they register with the tax authority and thus we do not know whether the firm previously existed or not.
For further reading see: Bruhn, Miriam and Jan Loeprick (2014) “Small business tax policy, informality, and tax evasion — evidence from Georgia” World Bank Policy Research Working Paper no. 7010


Join the Conversation