Download the January 2018 Global Economic Prospects report.
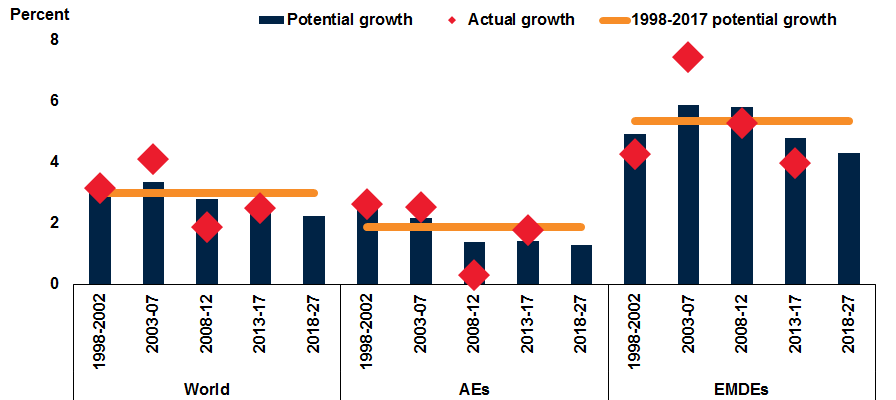
Despite an acceleration of global economic activity, potential output growth (the growth that can be sustained at full employment and capacity) has slowed. The slowdown reflected weak investment growth, slowing productivity growth, and demographic trends. These forces will continue, and, unless countered, will depress global potential growth further over the next ten years.

Sources: World Bank estimates; Haver Analytics; Penn World Tables; World Development Indicators, World Bank.
Notes: A. Based on production function approach, GDP-weighted averages for a sample of 30 advanced economies and 50 EMDEs.
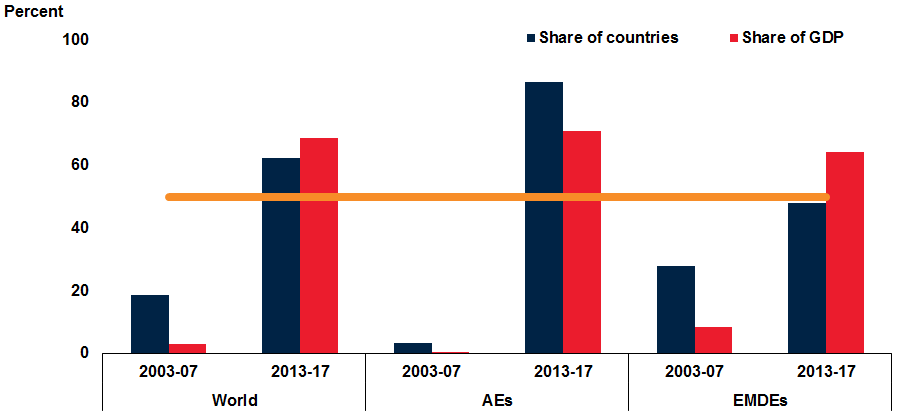
Weakness in Potential Growth is Broad-Based. This weakness in potential growth was broad-based across advanced, emerging market and developing economies. Slowing potential growth sets back prospects for raising standards of living and alleviating poverty.
Sources: World Bank estimates; Haver Analytics; Penn World Tables; World Development Indicators, World Bank.
Notes: Number of economies and their share of GDP among 30 advanced economies and 50 EMDEs in which potential growth is lower than its longer-term average (1998-2017).
Investment Growth Was Weak. Slowing potential growth mainly reflected slowing investment growth.

Sources: World Bank estimates; Haver Analytics; Penn World Tables; World Development Indicators, World Bank.
Notes: Number of economies and their share of GDP among 30 advanced economies and 50 EMDEs in which potential total factor productivity growth is lower than its longer-term average (1998-2017).
Productivity Growth Also Slowed. Slower total factor productivity growth also played a role. Total factor productivity refers to the output growth that cannot be explained by increases in the quantity of labor or capital.

Sources: World Bank estimates; Haver Analytics; Penn World Tables; World Development Indicators, World Bank.
Notes: Number of economies and their share of GDP among 139 countries in which investment growth is below the longer-term average (1998-2017).
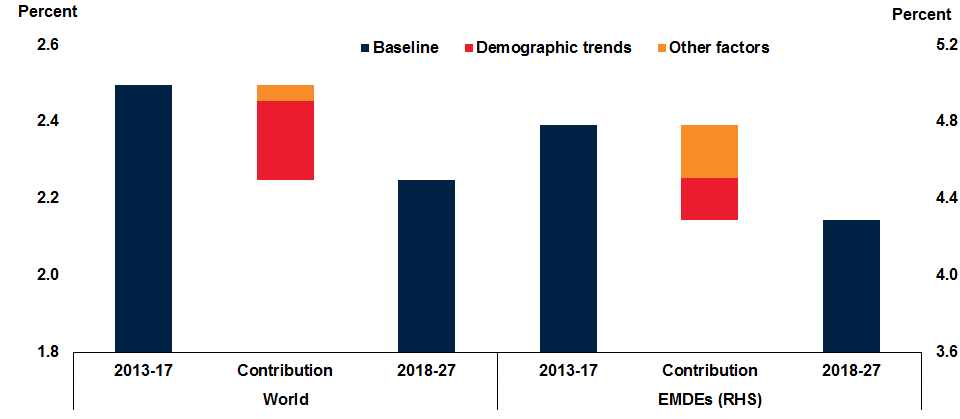
Over the Next Decade, A Further Slowdown in Potential Growth Is Likely. Over the next decade, trends in the fundamental drivers of potential growth, such as aging populations in many parts of the world, suggest a further slowdown.

Sources: World Bank estimates; Haver Analytics; Penn World Tables; World Development Indicators, World Bank.
Notes: GDP weighted averages. Derived using the production function-based potential growth as described in GEP Methodological Annex 3.1. “Other factors” reflects declining population growth, convergence-related productivity growth, policy changes, cohort effects, and a slowdown in investment growth relative to output growth. “Contribution” denotes contribution to change in potential growth between 2013-17 and 2018-27.
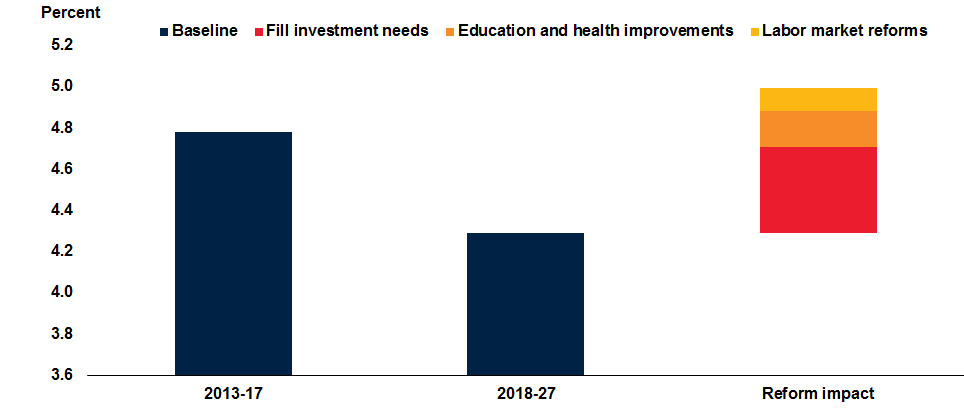
Reforms Could Help Spur Potential Growth. Initiatives to lift physical and human capital, encourage labor force participation, and improve institutions could help reverse the decline in potential growth.


Join the Conversation