Most commodity prices have been revised lower for 2019 and 2020 on the softening global growth outlook, according to the October 2019 Commodity Markets Outlook. Weaker manufacturing and trade are likely to dampen demand over the rest of this year and into the next.
Chart 1: Prices have fallen recently
Almost all major commodity price indexes fell in the third quarter of 2019, led by energy, which declined more than 8 percent. Agriculture and metals prices were down 2 percent each. Trade tensions, combined with weakness in global goods trade, manufacturing, and output growth, are weighing on commodity demand. In contrast, precious metal prices gained nearly 12 percent on heightened uncertainty.
Chart 2: Downward forecast revisions
In line with subdued global growth prospects, most price forecasts have been revised down for 2019, especially energy (-15 percent). Energy and metals prices are expected to continue to fall in 2020, while agricultural commodity prices should stabilize.

Chart 3: Slowing demand for energy
Energy prices fell sharply in the quarter, reaching their lowest level in two years. Oil prices dropped by 8 percent as worries about slowing global demand outweighed temporary production disruptions in Saudi Arabia. Expectations for oil demand in 2019 have been continually revised down. Oil prices are expected to average $60/bbl in 2019 and $58/bbl in 2020, down from $68/bbl in 2018, with concerns about the weak global growth outlook and robust oil production weighing on the market. In contrast, natural gas consumption continues to grow strongly, supporting stable prices into 2020, while coal prices are expected to continue to fall. A further slowdown in global growth is the key downside risk to energy price forecasts.
Chart 4: Agricultural prices stabilizing
Although most agricultural commodity prices appear to have stabilized recently, the factors that exerted downward pressure on them are still in place. These include multi-year-high stock levels for some grains, notably rice and wheat, favorable weather conditions in key producing regions, ongoing trade tensions, low energy costs, and weakening demand for some commodities. The World Bank’s Agricultural Price Index declined nearly 2 percent in 2019Q3 and stands more than 3 percent lower than a year ago. Agricultural prices are projected to fall nearly 5 percent in 2019 and to stabilize in 2020—a downward revision of the April forecast of about 2 percent in each year. Most of the risks are on the downside and emanate primarily from protracted trade tensions and lower input costs.
Chart 5: Metals to decline
The metals price index fell nearly 2 percent in the third quarter of 2019 (q/q) after two consecutive quarterly increases. The decline reflected a slowdown in global manufacturing activity, a prolonged stall in trade negotiations between China and the United States, and receding supply concerns for some metals. Metals prices are projected to ease modestly in 2020 following an expected decline of 5 percent in 2019. Risks to this outlook are tilted to the downside and include a sharper-than-expected global downturn and less effective policy stimulus in China.
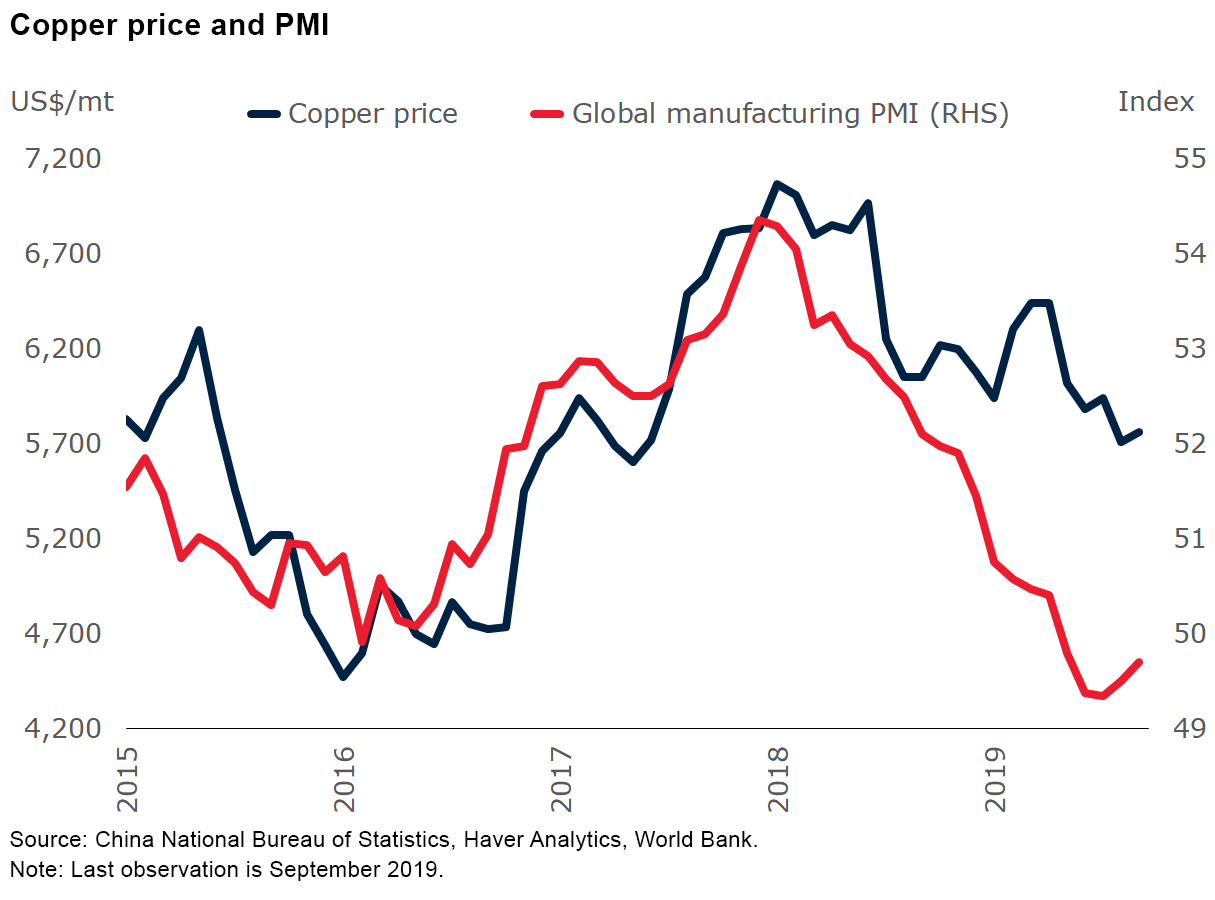
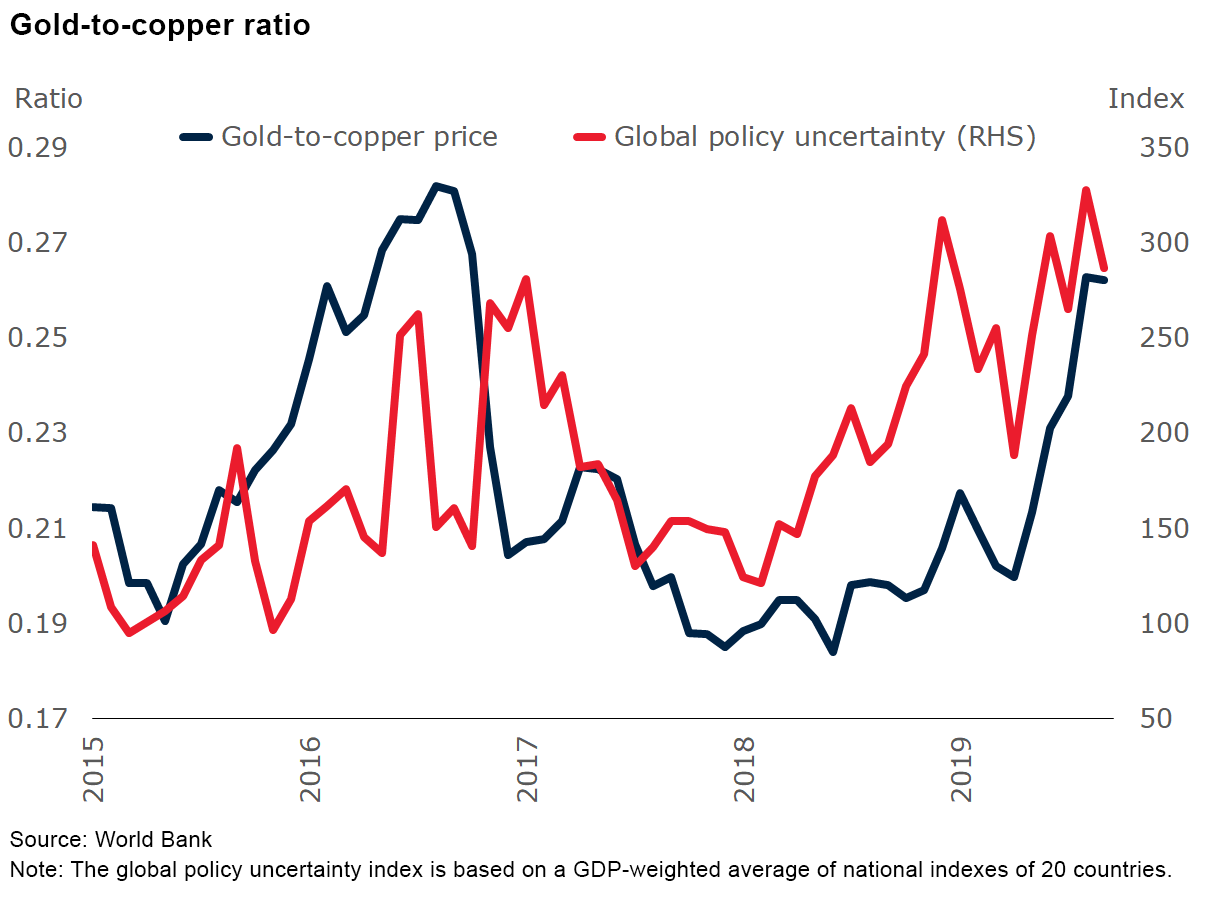
Chart 6: Uncertainty boosts precious metals
In contrast to other commodities, precious metals prices rose 13 percent in the third quarter of 2019 (q/q). Easing of monetary policy by the U.S. Federal Reserve, heightened global uncertainty, and robust physical demand all supported precious metals prices, pushing the gold-to-copper ratio—a barometer of the health of the global economy—to a 3-year high. Precious metals prices are anticipated to continue their upward trend and increase nearly 6 percent in 2020, following an expected gain of 8 percent in 2019. Most of the price risks, which are on the upside, relate to a sharper-than-expected global slowdown and heightened uncertainty. However, a stronger-than-expected U.S. dollar could push prices lower.


Join the Conversation