 Commodities charts.
Commodity prices soared in 2021, with prices of several commodities reaching all-time highs. The broad-based surge, led by energy and metals, partly reflected the strong rebound in demand from the global recession in 2020. It was amplified by weather-related supply disruptions for both fossil and renewable fuels. Looking ahead, as the energy transition progresses, it may amplify commodity price swings. Commodity-exporting emerging market and developing economies (EMDEs) generally need to take steps to better manage future commodity price shocks and to reduce their vulnerability to such shocks.
Read more on the topic in the January 2022 Global Economic Prospects.
EMDEs are heavily reliant on commodity exports.
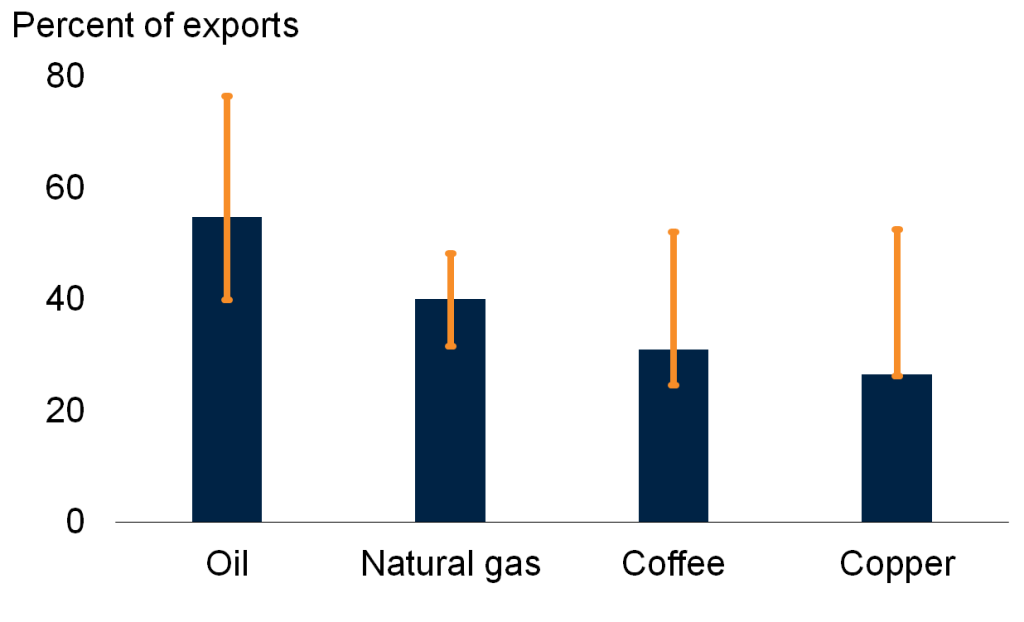
Commodities are critical sources of export and fiscal revenues for almost two-thirds of EMDEs and three-quarters of low-income countries (LICs). More than half of the world’s poor reside in commodity-exporting EMDEs. Dependence on commodities is particularly high for oil exporters. Countries whose exports are heavily concentrated in one or a few commodities tend to experience high volatility in their terms of trade and output growth.
Commodity exports in EMDEs as share of total exports

Sources: International Monetary Fund; UNU-Wider (database); World Bank.
Note: EMDEs = emerging market and developing economies.
Figure shows the median share of exports accounted for by oil, natural gas, copper, and coffee, for EMDE exporters of that commodity. Oil includes 20 EMDEs, copper 6, natural gas 5, and coffee 4. Blue bars show medians and orange whiskers show interquartile ranges
Commodity prices have undergone repeated cycles.
Commodity prices have undergone repeated cycles over the past fifty years. On average, the cycles lasted almost six years, peak to peak.
Booms in commodity prices have been more pronounced than slumps. The average price increase during booms was larger than the average price decline during slumps. Booms in crude oil prices, for example, were about four times larger than slumps, while booms in copper and coffee prices were about three times larger. Likewise, the average monthly speed of commodity price rises in booms (4 percent a month) was faster than that for price declines in slumps (1 percent a month).
Average amplitude of commodity cycles
Source: World Bank.
Note: A boom in commodity markets is defined as a trough-to-peak rise in commodity prices; a slump as a peak-to-trough decline. Amplitude measures the average real price change (in percentage terms) from trough to peak for booms and from peak to trough for slumps. Data from January 1970 to October 2021.
The rebound in commodity prices in 2020 was unusually sharp in historical comparison.
By historical comparison, the commodity price swings over 2020-21 have been exceptionally large. The collapse of energy prices in early 2020 was the steepest of any global recession in the past five decades, as was the subsequent recovery. Likewise, for metal and mineral prices, the pandemic-driven decline in 2020 was steeper than that during most of the previous global recessions. The subsequent price recovery was also faster than in previous episodes. This was mostly a reflection of the relatively short-lived nature of the pandemic-related recession, a rebound in demand from China due to strong industrial activity, and supply disruptions in Latin America.
Energy prices around global recessions and downturns.
Source: World Bank.
Note: The figure shows the World Bank’s energy price index. The horizontal axis represents the time period in months, where t=0 denotes the peak of global industrial production before global recessions and downturns since 1970, as in Kose, Sugawara, and Terrones 2020. The vertical axis measures the percent change in the commodity price series from a year earlier. The blue line shows the trajectory of the current commodity cycle around the COVID-19 recession, while the red line is the median of previous cycles around a global recession or downturn. Gray shaded areas represent the range of observed values in previous cycles. Data from January 1970 to October 2021.
Policy options
The swings in commodity prices witnessed in 2020-21 have once again highlighted the vulnerabilities of the many EMDEs, especially LICs, that are highly dependent on commodity exports. Looking ahead, the energy transition may cause further swings in commodity prices, which can have major macroeconomic consequences for EMDEs. To manage the impacts of commodity price cycles, commodity-exporting EMDEs can strengthen their fiscal, monetary, and prudential policy frameworks. The tendency of commodity price booms to be more pronounced than price slumps, as witnessed over the past 50 years, underscores the importance for countries to save windfall revenues during good times to create policy to respond to future shocks. For example, oil exporters could use the current opportunity afforded by higher oil revenues to rebuild policy space and direct spending toward addressing longer-term challenges. Countries can also take measures to reduce their reliance on commodities by encouraging diversification of exports and, more importantly, ‘national asset portfolios’—investing to diversify their physical and human capital and strengthen their institutions.


Join the Conversation