 Photo by: BBSTUDIOPHOTO/Shutterstock
Global trade is expected to contract more in 2020 than it did during the global financial crisis, partly due to the disruptions that the coronavirus (COVID-19) pandemic has caused to global value chains (GVCs). In the wake of this shock, firms and governments could seek to reduce the risk exposure of supply chains over the medium term by increasing the geographical diversity of their suppliers. Countries that wish to seize this opportunity could pursue the sound government policies that have helped other countries become more integrated into GVCs, namely improving physical capital through infrastructure investment, and improving human capital through education and public health.
Trade growth tends to fall more than GDP during recessions
The propagation of shocks through industry interlinkages such as GVCs is one of the reasons why trade tends to fall more than GDP during crises.
GDP elasticity of global trade
Source: World Bank.
Note: Bars show the coefficient of a simple regression of global trade on GDP from 2011-2019 "during expansions" and using 2009, 1991, 1982, and 1975 "during recessions". Recession is defined as defined as a contraction in real per capita GDP. These roughly correspond with more sophisticated estimates such as Bems et al. (2010); Bussière et al. (2013); Constantinescu, Mattoo and Ruta (2015); and Freund (2009).
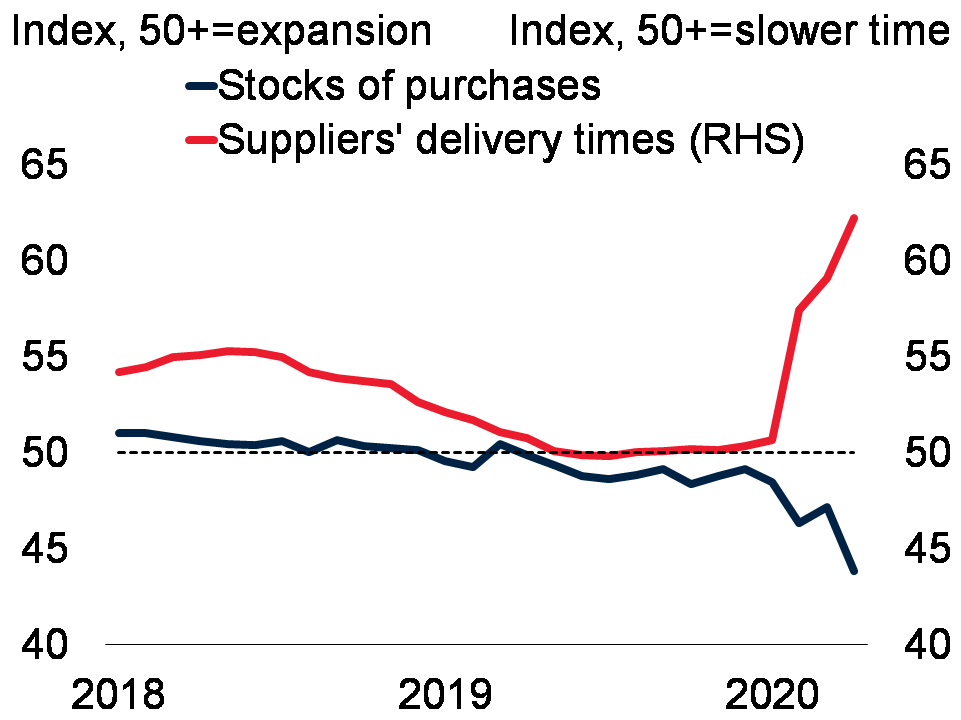
Supplies of key inputs to GVC production are being interrupted
Many high-productivity GVC participants rely on just-in-time delivery of inputs and lean inventories, and are struggling with delayed shipments and dwindling inventories.
Subcomponents of the global manufacturing PMI
Source: Haver Analytics; World Bank.
Note: PMI = Purchasing Managers’ Index. Figure shows the global stocks of purchases and the suppliers’ delivery times PMI. For the stocks of purchases, PMI readings above (below) 50 indicate expansion (contraction) in economic activity; the suppliers’ delivery times PMI readings above (below) 50 indicate slower (faster) deliveries. This is reversed from how this subcomponent is normally presented, to reflect that the slowdown in deliveries is a consequence of production disruptions rather than a sign that the economy is working near full capacity. Last observation is April 2020.
The pandemic has disrupted the central nodes of GVC activity
The countries at the center of the initial waves of the global pandemic are also those at the center of GVC production, which will have knock-on effects to other links in value chains.
Major economies’ share of global aggregates
Source: World Trade Organization; World Bank.
Note: Trade is the average of export and import volumes. “Euro Area top 4” is a weighted average of Germany, France, Italy, and Spain.
A greater shock to demand than supply
Thus far, the steepest declines in trade and industrial production have been concentrated in countries active in forward-value-added (i.e. countries that export more basic intermediate goods for higher-value-added), which is consistent with a greater shock to demand than to supply.
Mobility and production growth data, by concentration of forward value added in trade
Source: Google; Organisation for Economic Co-operation and Development; World Bank.
Note: Countries are considered to have “low” forward value added if the domestic value added in foreign exports as a share of gross exports is less than 25 percent, and “high” if above 25 percent. The same threshold applies for backward forward value added, in terms of the foreign value added share of gross exports. Last observation for industrial production is March 2020. “Mobility” is the percent change in workplace mobility relative to the global median change for May 21st from baseline, which is the median value for the corresponding day of the week during the 5-week period January 3-February 6, 2020, based on data from Google. Sample includes 32 advanced economies and 23 EMDEs for the Mobility data and 29 advanced economies and 22 EMDEs for the IP.
Many of the worst affected sectors are those that are closely integrated in global trade
Using a global computable general equilibrium (CGE) model, a stylized representation of the pandemic results in sharp contractions in many sectors that are well-integrated in GVCs, as illustrated by the example of Vietnam.
Sectoral responses in a modeled COVID-19 shock: The case of Vietnam
Source: World Bank.
Note: “Foreign Value Added share of exports” is the value added of inputs that were imported in order to produce intermediate or final goods/services to be exported. Sectors are as follows: A=Agriculture, B=Fishing, C=Mining and Quarrying, D=Food & Beverages, E=Textiles and Wearing Apparel, F=Wood and Paper, G=Petroleum, Chemical and Non-Metallic Mineral Products, H=Metal Products, I=Electrical and Machinery, J=Transport Equipment, K=Other Manufacturing, L=Electricity, Gas and Water, M=Construction, N=Wholesale Trade, O=Transport, P=Post and Telecommunications, and Q=Other Services.


Join the Conversation