Inclusive growth refers to both the pace and distribution of economic growth. For growth to be sustainable and effective in reducing poverty, it needs to be inclusive (Berg and Ostry 2011a, Kraay 2004). Traditionally, poverty (or inequality) and economic growth analyses have been conducted separately. Recent work indicates that there may not be a trade-off between equity and efficiency, as suggested by Okun (1975), and “that it would be a big mistake to separate analyses of growth and income distribution” (Berg and Ostry 2011b). Ianchovichina and Gable (2012) describe inclusive growth as raising the pace of growth and enlarging the size of the economy by providing a level playing field for investment and increasing productive employment opportunities.
In a recent paper with Rahul Anand and Shanaka Jay Peiris, we present a measure of inclusive growth that is in line with the absolute definition of pro-poor growth, but not the relative definition. Under the absolute definition, growth is considered to be pro-poor as long as poor people benefit in absolute terms, as reflected in some agreed measures of poverty (Ravallion and Chen 2003). In contrast, under the relative definition, growth is pro-poor if and only if the incomes of poor people grow faster than those of the population as a whole; that is, inequality declines (Dollar and Kraay 2002, IMF 2011). By focusing on inequality, the relative definition could lead to suboptimal outcomes for both poor and nonpoor households. For example, a society attempting to achieve pro-poor growth under the relative definition would favor an outcome characterized by average income growth of 2%, where the income of poor households grew by 3% over an outcome where average growth was 6%, but the incomes of poor households grew by only 4%. The dynamic measure of inclusive growth proposed here allows an analysis of income distribution that can distinguish between countries where per capita income growth was the same for the top and the bottom of the pyramid by accounting for the pace of growth.
Measuring inclusive growth
We propose a measure of inclusive growth based on a utilitarian social welfare function drawn from consumer choice literature, where inclusive growth depends on two factors: income growth and income distribution. The underlying social welfare function must satisfy two properties to capture these features: it is increasing in its argument (to capture growth dimension) and it satisfies the transfer property – any transfer of income from a poor person to a richer person reduces the value of the function (to capture distributional dimension).
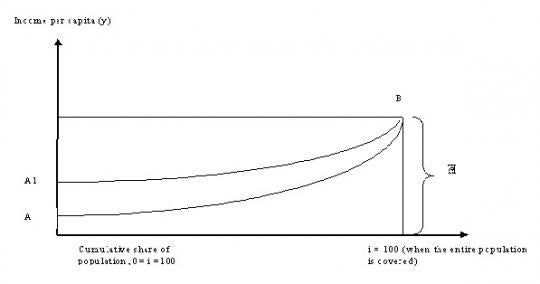
To illustrate the point made above, Figure 1 depicts two social mobility curves with the same average income (ȳ) but different degrees of inclusiveness (i.e., different income distribution). The social mobility curve ‘A1B’ is more inclusive than the social mobility curve ‘AB’, as the average income of the bottom segment of the society is higher. To capture the magnitude of the change in income distribution, we use a simple form of the social mobility function by calculating an index from the area under the social mobility curve. Greater the area under the social mobility curve (ȳ*) the higher is inclusive growth. If the income of everyone in the population is same (i.e. if income distribution is completely equitable) then ȳ* will be equal to ȳ. If ȳ* is lower than ȳ, it implies that the distribution of income is inequitable. So, the deviation of ȳ* from ȳ is an indication of equity in income distribution, and we call this ‘omega’.
Figure 1. Shifts in Social Mobility Curve 
Tracking the evolution of inclusive growth
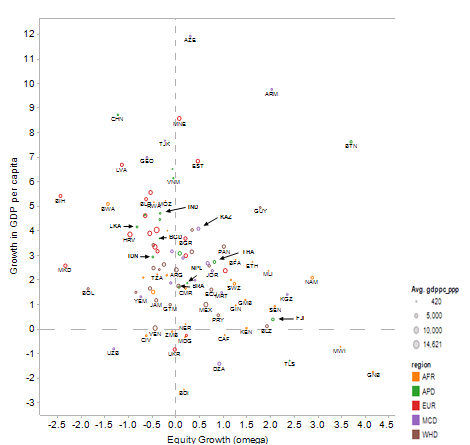
The limited gains in inclusiveness are explained by relatively low growth in some countries and widening inequality in others. These dispersions are depicted in Figure 2, where most countries fall into the two quadrants that show higher per capita income and a lower/or higher level of inequity, suggesting that there is no simple trade-off between growth and equality. In most cases, economic growth shifted the indifference curves upward, and there have been very few intersections of social mobility curves, suggesting unambiguous gains in inclusiveness. However, the relative magnitude of shift and curvature of indifference curves both matter.
Figure 2. Distribution of Emerging Markets on Inclusiveness Matrix
Source: Authors’ calculations.
Note: The chart measures proportionate average annual change. The period used is the early 1990s to the latest available data. Size represents the initial size of the economy (GDP per capita), that is, the legend represents countries with purchasing power parity (PPP) GDP per capita below 420; 5,000; 10,000; and 14,621, respectively. Different regional codes are denoted by different colors.
China’s inclusive growth is primarily a growth story. Rapid growth in per capita income has benefitted everyone, but the gains have been much greater for the rich (as depicted by negative value on equity [omega] and steepening of the social mobility curve). Thus, in China, high growth has eclipsed the growing inequality to produce a large upward shift of the social mobility curve and higher inclusive growth. A similar story holds for India, where high growth has benefitted everyone, but equity has gone down. On other hand, the increase in inclusiveness in Brazil, Mexico, Malaysia, and Thailand has come from growth as well as improvement in equity (positive omega), but growth has not been fast enough to benefit the entire population as much as in China.
Across emerging markets as a whole, the heterogeneity in economic growth performance and income distribution outcomes provide insight to the growth-equity trade-off. Conventional wisdom suggests that growth comes at the price of rising inequality, but regions differ in their growth-equity trade-off. In some instances, strong growth has been achieved without compromising equity.
Our dynamic measure of inclusive growth permits us to focus on inequality as well as distinguish between countries where per capita income growth was the same for the top and the bottom of the income pyramid by accounting for the pace of growth. Anand and others (2013) indicate that macroeconomic stability, human capital, and structural changes are foundations for achieving inclusive growth. The role of technological change and globalization could also be positive with foreign direct investment and trade openness fostering greater inclusiveness while financial deepening and technological change have indiscernible effects.
Conclusions
The call for inclusive growth has been unanimously broadcasted by policymakers across the world. The Arab Spring, the growing divide between Main Street and Wall Street in advanced economies, and the ‘three-speed’ world economy and growing uncertainties around prospects of prosperity have placed inclusive growth at the forefront of policy debates. The aspirant for inclusion must keep growth as a primer, since inclusive growth is about both the pace and distribution of growth.
The standard economic growth drivers in the literature such as conditional convergence, education levels, and fixed investment are important to foster inclusive growth, while the role of technological change has a less discernible impact. In terms of structural change and globalization, trade openness and foreign direct investment fosters inclusive growth with a potentially positive role played by financial openness, in general. Moving up the value chain in both goods and service exports helps foster inclusive growth. However, financial deepening could have a negative impact, although the impact is not statistically significant. Macroeconomic stability is reinforced as a key ingredient for inclusive growth. Competitiveness and infrastructure development are also be important for inclusive growth, although the statistical evidence is weak.
There remain several questions for future research. Many countries responded to the Global Crisis through large fiscal stimulus and/or bank bailouts, which are being withdrawn or are being met with growing austerity. The relation between fiscal consolidation and inclusive growth is worthy of further study. The availability of more granular data will be important to analyze the evolution of inclusive growth at the national and sub-national levels across regions. Secondly, the speed of technological advancement, its reach and access, and the channels through which it can foster or hinder inclusive growth, is another area for future research. Lastly, with respect to job creation, it will be relevant to better understand the links between unemployment and labor market institutions that foster inclusive growth. Researchers can explore how data analytics and technology infrastructures can nurture an entrepreneurial ecosystem that creates jobs, equity and explosive growth.
Editor’s note: Views expressed here are those of the authors and not necessarily of the institution they may be associated with. This is a summary of a International Monetary Fund Working Paper titled, “Inclusive Growth: Measurement and Determinants” by Anand et al. (2013).


Join the Conversation