 Photo by: By Wagner Santos de Almeida/Shutterstock
Economic theory anchors welfare measurement in the household’s usual rate of consumption, which is the outcome of a long-run optimization that depends on household preferences and expectations about permanent income. However, welfare monitoring in the developing world typically relies on short-term snapshots of consumption from household surveys. Short-term deviations from desired patterns of consumption in the long-term can mislead poverty and inequality assessments. To address this issue, our new paper Insights and Illusions of Consumption Measurement demonstrates how to obtain correct welfare comparisons from repeated snapshot measurements of consumption collected in one occasion.
Measuring welfare with snapshots
Mathematically, we can represent the household’s usual rate of consumption by Y^*. Welfare measurement aims to assess disparities in Y^* across households. One could measure Y^* only by following the same households for an extended time to compute their per-week consumption averages, using long panels or administrative archives on household transactions, for example. However, since these data are unavailable in much of the developing world, researchers rely on household surveys to learn about Y^* from consumption measurements with reference to a short period, usually one or two weeks.
What can go wrong?
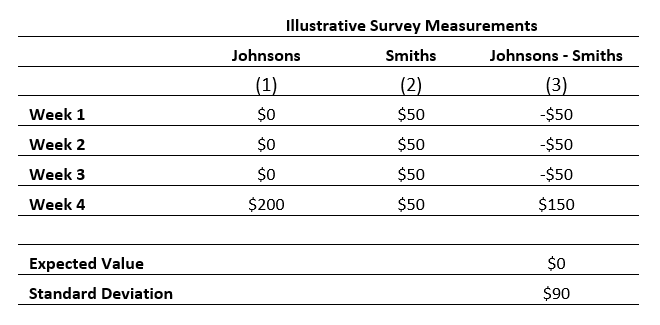
This snapshot approach can result in skewed assessments of household well-being. To see why, consider two households (the Smiths and the Johnsons) who both budget to spend the same dollar amount over a period of four weeks and therefore have the same Y^*.
During this period, both families plan to spend $200 on dining out. The Smiths treat themselves to a $50 pizza dinner every week. The Johnsons, instead, prefer a $200 dinner once every four weeks. Table 1 shows how these preferences can affect how surveys depict the households’ comparative consumption. Columns 1 and 2 show an example of possible spending patterns for a typical month, while column 3 demonstrates that the relative position of the two households in the data depends on the randomly selected week considered for the interview.
Differences in survey measurements for the Smiths and the Johnsons reflect their preferences for consumption frequency, not a measurement problem. Thus, spurious differences in household well-being may arise even when consumption is measured without errors.
On the bright side, the bottom of column 3 shows that we should expect no mistake, on average, in the welfare ranking of households like the Johnsons and the Smiths, despite their different consumption patterns. Therefore, there is theoretical appeal in assuming that survey measurements are random variables centered on well-being. Our paper discusses why acquisition diaries will yield survey measurements with this property. However, the variance of all possible differences in column 3 is positive and large, despite the same underlying welfare Y^*. It follows that even survey measurements doing a good job on average may convey the wrong conclusions about the welfare distribution. Our research demonstrates that recall interviews are less prone to wrong conclusions than acquisition diaries.
Our experiment
We leverage a large-scale experiment on consumption measurement designed for the Iraq Household and Socio-Economic Survey (IHSES). All 25,000 participating households filled out a one-week diary with the assistance of enumerators. About one-third of the sample was randomized to an additional survey module, administered before the diary, asking them to recall food consumption in the previous week. This design yields a panel with two observations for over 8,000 households, using recalled consumption for the week preceding the interview and acquisitions recorded during the week-long diary.
We show how the population distribution of Y^* can be estimated from this short panel of diary-recall measurements. Differently from past research, we can test empirically which collection mode – diary or recall – yields the welfare conclusions closest to those that would be computed if Y^* were observed. Panel A of the figure shows that diary and recall data are not rank preserving, meaning that they do not order the same household identically in the population. Panel B shows histograms of IHSES diary and recall data compared with the distribution of Y^* (the continuous line) obtained using our methodology.
Differences between recalled consumption and acquisitions from diaries
Implications for designing household surveys
The presumption that diaries outperform recall data for the measurement of household well-being finds no support in our data. The lower tail of the recall distribution in panel B is closer to that of Y^*, and mismeasurement from diaries is more substantial. This has important implications for the computation of poverty statistics in Iraq, which are more accurate using recall data. We also show in the paper that several indicators of welfare inequality, like the Gini coefficient, better reflect the underlying distribution of Y^* when they use recall data. We conclude that the higher costs of using a diary don’t bring more accuracy for poverty or inequality measurement.
Acquisitions in diaries are random variables centered on household well-being Y^*, as we said above. However, we demonstrate empirically that deviations from Y^* can be substantial. For example, the likelihood of measuring less than half of the actual value of Y^* is around 15%. The likelihood of attributing a value for Y^*at least twice the size of the actual one is about 4%. The same conclusions hold for the most perishable components of food, which implies that mismeasurements primarily depend on how households plan to smooth their consumption (as with the Smiths and the Johnsons). Even perfectly measured values of consumption in a random week (obtained, for example, from stock inflows and outflows) will not solve this problem.
Finally, our investigation does not find evidence of zero-mean or classical reporting errors in recall data, which is a conclusion often conjectured in the literature. Our research design allows us to prove this conjecture, and provides guidance on how to sign the bias from recall errors in empirical work.


Join the Conversation