 Families wait to collect food
Food insecurity is complex problem with profound and long-lasting humanitarian consequences. Last year, more than 820 million people were undernourished and at least 130 million were estimated to be in food crisis. Although humanitarian organizations frequently react swiftly and effectively once a crisis is declared, crisis declarations are made based on increased mortality which means irreversible damage has already been done.
Getting a head start on anticipating looming food crises is the common goal of two recent PRWP publications. The work explores the capacity of readily observable data and statistical models to provide risk estimates at alternative time horizons and with different geographic detail. “Predicting Food Crises”, predicts local outbreaks of food crises through random forests (RF). “Stochastic Modeling of Food Insecurity” models the distribution of a country’s population across different levels of food insecurity using panel vector-autoregressions (PVARs). Both papers use Integrated Food Security Phase Classification (IPC) system reported by FEWS NET, for 1162 districts in 21 countries since 2009. Both papers generate predictions of food insecurity using a set of covariates including remote-sensing data on environmental factors relating to food production; the incidence of violent conflict; and market signals in the form of food price dynamics.
What makes these approaches different?
The papers develop two different approaches to tackle the challenge of predicting crises, both with their own advantages and disadvantages.
Expected risk versus tail risk: The RF treats food crisis prediction as a Prediction Policy Problem (Kleinberg et al. (2015)) requiring a model that makes accurate out-of-sample predictions in order to inform policy decisions. The RF approaches this as a simple two-way classification problem and asks: how likely is a food crisis in a given district 12 months from now, and should urgent action be taken now - yes or no? As such, it provides information about expected risks in the near future. In contrast, the PVAR works with data at the national level and models the dynamics of population shares in different stages of food insecurity. It generates predictions for the distribution of a country’s population at risk of different levels of food insecurity and enables simulation of a range of possible outcomes with associated probabilities. This means that the model can explore the risk and potential impacts of extreme events over longer time horizons.
Frequencies, horizons and past values. Another difference lies in how the models use the history of previous food insecurity in a region to predict future food insecurity. The RF approach avoids using previous data on food insecurity as predictor variables. This comes at the cost estimating a larger model but it makes it possible to generate predictions whenever the explanatory variables are available, without being constrained by the more limited availability of up-to-date data on food insecurity itself (which is neither as widely or as frequently available as the explanatory variables used in the prediction model). In contrast, past data on food insecurity is the main ingredient for the stochastic PVAR model. This restricts the model to less frequent predictions, and only for countries currently covered by FEWS NET, but with the benefit of capturing transitions between low and high-risk states. In short, the RF draws a highly accurate short-term picture for individual districts whereas the stochastic PVAR uses a broader brush to trace out a country’s possible long-term trends.
Small data, big problems: A key challenge with modeling food insecurity across a wide range of countries is that high-quality data are available only over the past decade. This makes it difficult to draw general lessons from the limited available data. The PVAR adopts the view that the short historical record limits the extent to which patterns can be extrapolated accurately into the future. As a solution, it accommodates expert opinion in the form of Bayesian priors to improve the estimation. This is particularly useful when facing unprecedented cases whose consequences are more apparent to human experts but difficult for a model to grasp from historical data. For the RF model, the issue is slightly different. Since it models food insecurity at a subnational level, it builds on a much richer data set, and the RF is able to capture complex interactions between country characteristics and the explanatory variables to generate better predictions. The challenge, however, is that the paper aims at predicting crisis events which fortunately rare – but very costly when they do occur. The combination of high-costs concentrated in rare outcomes implies that standard models whose average predictions are heavily tilted toward the most common outcome – no crisis – are not useful for prediction purposes. To solve this problem, the RF predictions are calibrated to minimize a prediction loss function reflecting the user-provided cost of false positives (predicting a non-existent outbreak) relative to false negatives (failing to predict an outbreak). The loss function can be adjusted to represent preferences of different groups of decision makers, for instance, one that is willing to risk raising more alarms in order to predict and prevent more large-scale disasters.
What do the papers find?
One interesting takeaway from the RF model is that there is a tradeoff between model complexity and performance. The first paper compares different machine learning approaches to the same classification problem and finds that the RF approach improves substantially over linear approaches, but that more complex deep learning methods do not provide further improvement. This makes the RF solution attractive as it is neither too complicated, like a neural network, nor too simple, like a linear classifier, while it still achieves strong predictive performance.
Although RF models are sometimes considered “black boxes”, it is in fact straightforward to identify the predictive power of different groups of explanatory variables. The figure below gives an example for two countries. The height of each bar indicates the percentage of the country’s population predicted to be in food crisis as modeled by the RF. The colors indicate how that prediction is broken down by the importance of four groups of predictors: market-level food prices, remotely sensed rainfall data, remotely sensed agricultural stress data, and conflict event data. The points mark actual FEWS NET assessments of food insecurity that the model seeks to predict. The example shows that the RF attributes a high importance to environmental factors in Somalia during two episodes of drought-related extreme food insecurity, while it relies more strongly on food price inflation in South Sudan after the economic collapse. Such analyses can be replicated at low cost once a model has been estimated, showing how food insecurity risks can be predicted using readily-available and verifiable data.

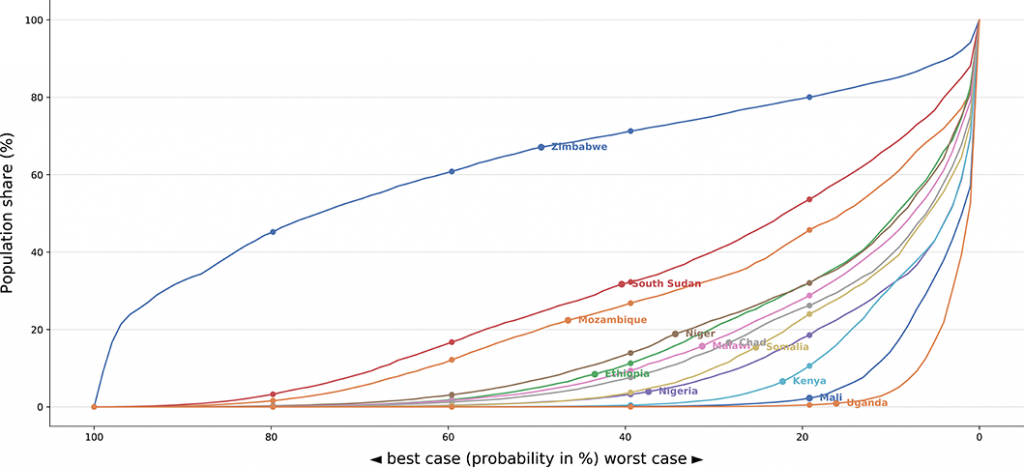
One key feature of the stochastic PVAR model is that it is suitable to assess risks and vulnerabilities, as shown in the figure below. Each line on the graph represents a different country at the beginning of 2020 and shows the probability (on the horizontal axis) of a given share of the country’s population being in food insecurity (on the vertical axis). The fact that the blue line (for Zimbabwe) lies above all the others indicates a much higher risk of food insecurity compared with other countries with lower curves.
Both papers find that econometric models can generate robust predictions of the risk of future food insecurity. But models alone are not enough. The operational requirements to address different food crises are unique to each setting and require careful deliberation of human and economic implications of actions. Such analyses can be informed by – but at the same time involve factors clearly beyond the scope of – econometric models.


Join the Conversation