It’s financial inclusion week—a series of events exploring "the most pressing actions needed to advance financial inclusion globally"—making this a perfect time to launch the 2017 Global Findex microdata.
In April, we released country-level indicators on account ownership, digital savings, savings, credit, and financial resilience. Now comes the microdata – individual-level survey responses from roughly 150,000 adults living in more than 140 economies globally.
The good thing about the microdata is it lets you slice up the Global Findex variables in countless different ways. It's also easy to mix in data from other sources and explore the factors driving financial inclusion.
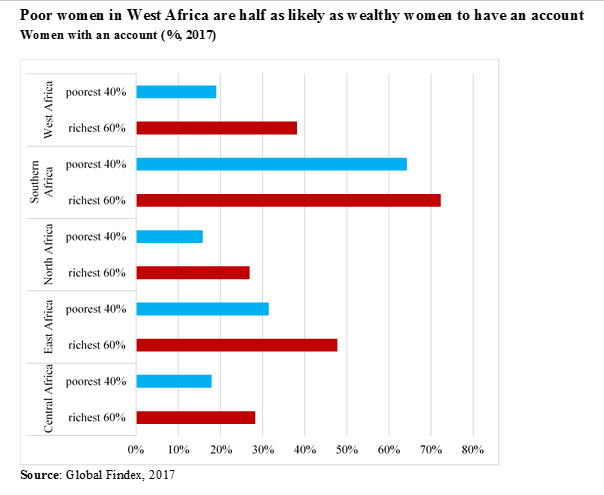
Here's one small example. Let's say you work on women's financial inclusion, and you want to probe West Africa's surge in account ownership. Looking at the main Global Findex data, you can easily find the share of women with an account.
But maybe you only want to focus on the poorest 20 percent of women, or women who are out of the workforce. Using the microdata, you can define the demographic categories and produce the numbers. Don't get too carried away, though—you should only trust numbers for which you have at least 100 observations.
The microdata's granular detail also makes it easier to unpack financial inclusion trends. Overall, the Global Findex shows a sharp rise in digital payments from 2014-2017. Microdata hints at where that progress came from.
In Ghana, for example, digital payments nearly doubled. Three years ago, a quarter of adults used such payments; today, half do. A look at the data suggests mobile money accounts were a factor in this increase. While the share of adults with only a financial institution account was mostly flat, the share with both types of account nearly quadrupled, to 24 percent. During the same period, there was a doubling of the number of adults using only mobile money.
But mobile money exists mostly in Sub-Saharan Africa and a few other emerging economies, including Bangladesh and Paraguay. So what else is behind the global digital payments increase?
Consider Thailand, where the share of adults using digital payments hit 62 percent, up from 33 percent in 2014. Part of the explanation might be that use of debit cards doubled during the same period, as did the share of adults using an account to receive wage payments. Meanwhile, receipt of digital government transfers nearly tripled.
The microdata clearly cannot capture every type of transaction or definitively explain financial inclusion trends in every country. But we hope it will help researchers better understand what's going on in the financial inclusion world—and open opportunities for further progress.


Join the Conversation