The COVID-19 (coronavirus) pandemic and associated containment measures are expected to cause far-reaching damage to economies around the world. Firms are suffering from reduced demand due to movement restrictions, from reduced labor supply and from constraints to sourcing material inputs. The breakup of otherwise healthy businesses in response to a temporary shock implies large social costs. Governments are therefore intent on designing emergency policies to keep businesses afloat. Yet, limited availability of firm censuses and survey data in many lower-income countries hampers policy makers’ ability to simulate economic scenarios and the effect of policy measures.
This blog discusses how policy makers can use firm-level administrative tax records to simulate the effects of the COVID-19 shock. Corporate income tax declarations usually capture the universe of formal-sector firms in a country. While this does not cover informal firms, formal firms are a relevant group to study since they can be reached via formal tax policy measures and liquidity provision (Discussed in contributions by ODI/IFS, ICTD, IMF and OECD.) For a discussion on how to support informal sector firms and their workers, see presentations by Miriam Bruhn, Leonardo Iacovone, this policy note and the recording of a World Bank seminar on policies for small and informal firms. Our team is advising governments on simulating the impact of COVID-19 using tax data in several countries. To make the methods available to a broader audience, we present an illustrative analysis for a generic country, constructed as an average of a set of countries we are working with. For those who would like to conduct the analysis in their own country, we provide replication codes for STATA and R users.
Our analysis relies on a few simple assumptions about the shock firms face and the structure of firms’ revenue and costs. We simulate scenarios in which a demand shock induces a loss in revenue equivalent to either one or three months of annual revenue, and compare these to the baseline. We assume that firms aim to weather the shock so that they can scale their production capacity back up swiftly at the end of the crisis. In this very stylized world, firms can reduce their material costs proportionally to the drop in demand, but they are reluctant to reduce their labor costs as re-contracting is costly, and they cannot adjust their fixed costs. Finally, we assume that credit constraints prevent borrowing beyond any existing loans which are used to cover predictable losses (i.e. losses unrelated to the shock). Our analysis is nowhere close to exhaustive and is not yet linked to specific policy responses. It is meant to open discussions about how to analyze the effect of COVID-19 on firms, and as a starting point for more complex scenario simulations.
First, we ask what share of firms would need government support to “stay afloat.” Assuming credit constraints, a rough indication for firms’ ability to stay afloat is a weakly positive profit rate. We start by simulating scenarios where firms lose a share of their revenue, while all costs remain constant. The results are displayed in Figure 1(a): In the generic country, 79% of firms are profitable at baseline. This share is reduced to 26% with only a one-month output loss, and to 6% with a more likely three-months output loss. In our country-specific simulations, we found that the increase in the share of loss-making firms varies substantially across countries and tends to be higher in lower-income countries.
In addition to simulating a pure revenue shock, we simulate a more realistic scenario where firms adjust their material costs proportionally to their revenue loss. Figure 1(b) shows firms’ profitability distribution in this case. Compared to the baseline where 79% of firms are profitable, 43% of firms remain profitable with a one-month output loss, but only 18% with a three-month output loss. We also observe that for a large enough revenue shock the distribution becomes bimodal: while firms using mainly material inputs and little labor or capital inputs can fully adjust, firms with a small share of material inputs in total cost have little margin to adjust.
Figure 1: Firm Profitability Under a Shock to Revenue


(a) No Adjustment to Costs (b) Material Costs Adjust in Proportion
Second, we study by how much employers would need to slash their yearly wage bill in the absence of government support. We continue to assume that material inputs adjust first, and that firms only cut their wage bill if they are still unprofitable after the material inputs adjustment. Figure 2a (b) shows the resulting distribution of reduction in the yearly wage bill for a one or three months revenue shock. The figure is bi-modal: the first spike corresponds to firms which are sufficiently profitable at baseline: they absorb the shock and keep paying their workers. The second spike corresponds to firms which have to cut their wage bill proportionally to the shock in order to stay afloat. In the middle of the distribution, a share of firms reduces their wage bill somewhat (but less than proportionally to the shock) and achieves zero profit: providing even modest wage subsidies to these firms has the potential to save jobs. The average firm would cut its yearly wage bill by 4% in the 1-month-revenue scenario and by 19% in the 3-month revenue loss scenario. On aggregate, weighting by firms’ yearly wage bill, this would lead to a cut in payroll of 10% [resp. 2%] of the formal economy’s total yearly wage bill in the 3-month-revenue loss [resp. 1-month-revenue loss] scenario.
Figure 2: Wage Bill Reduction from a Revenue Shock (Material Costs Adjust First)


(a) 1-month Revenue Loss (b) 3-month Revenue Loss
Third, we predict firms’ additional exit rate under different revenue-shock scenarios. We use the panel dimension of the data to ask: what is the excess exit rate for firms which faced in the past an (endogenous) shock in revenue? Concretely, we use recent years of panel data to estimate firm exit as a function of past changes in revenue, profits and other observable characteristics. Figure 3 shows that the exit rate appears exponential to the size of the revenue shock: while moderate shocks are absorbed, larger shocks take a permanent toll. Under the likely scenario of a 30 to 50% loss in yearly revenue, we find that the crisis could induce an additional exit of 3% of firms compared to a baseline exit rate of 7%. If the revenue loss goes beyond 50% of yearly revenue, then the exit rate could double from 7% to 14%. Aggregating this at the economy-wide level, the crisis-induced firm exit would wipe out “permanently” 2.5% [resp. 6%] of total output and 1.5% [resp. 3.5%] of the total wage bill, for a 30-50% [resp. more than 50%] revenue shock.
Figure 3: Firms’ Exit Rate Given the Revenue Shocks, Assuming No Government Responses
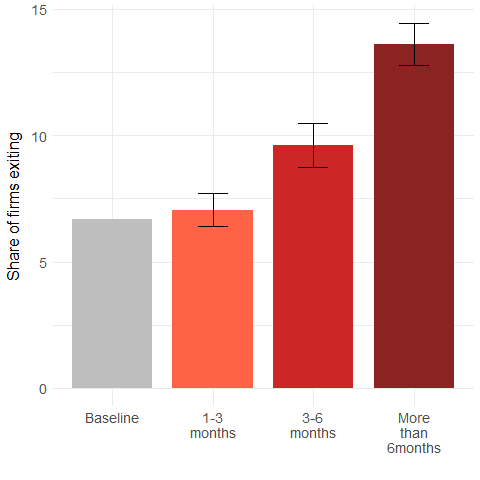
Note: Revenue losses of 1-3 months, 3-6 months and more than 6 months correspond to a 10-30%, a 30-50% and > 50% drop in revenue, respectively.
Overall, we learn that even small revenue shocks push the majority of firms into loss-making territory. If firms loose three months of revenue, then only 18% would remain profitable without laying off workers, 10% of the economy-wide yearly formal payroll would be slashed, and the share of firm exiting would increase by close to 50% (from 7 to 10%). These results are relatively homogeneous across the countries we study. Developing countries might be slightly cushioned, since firms could join the informal sector rather than shut down completely, and their true profitability may be higher than observed in the data, due to misreporting. On the other hand, these countries have less fiscal space to support firms via wage subsidies or guaranteed loans (Loayza and Pennings), and entrepreneurs have limited access to savings and insurance. Our analysis can serve to estimate the size and scope of rescue packages needed to effectively cushion the formal economy.
This post is a first and incomplete attempt to analyze the empirical questions at hand. In future work, we aim to model more complex adjustment scenarios, investigate heterogeneity across sectors, firm size and countries, and simulate specific government responses, such as wage subsidies. Comments and suggestions are welcome!


Join the Conversation