 A woman using tablet computer exploring charts. | © shutterstock.com
What is the marginal welfare cost of taxation in African countries? How overvalued is the CFA Franc? When the price of copper falls, what happens to the distribution of income in Zambia? What fiscal rules should a commodity exporting country like Niger adopt when faced with uncertainty in world prices? If economic agents are forward-looking, how does trade reform affect investment? If exports confer learning-by-doing externalities, by how much should they be subsidized?
These questions have at least two common features. First, they are general equilibrium in nature—several, linked markets are involved. Second, they are empirical questions—the answer depends on quantitative magnitudes. To answer these questions, especially in data-scarce environments, we developed a simple general-equilibrium model, the 1-2-3 model, that can be calibrated with only national accounts data. The one-country model divides the economy into two producing sectors, exports (E) and domestic goods (D), and a third good, imports (M), that are consumed but not produced domestically. Exports and domestic goods are connected through a transformation function; and imports and domestic goods are imperfect substitutes in demand. Despite its simplicity, the 1-2-3 model captures most of the salient mechanisms of more complicated models and, indeed, has been used to answer all the questions above.
However, in most applications of the model, the two critical elasticities—that of transformation between E and D, and of substitution between M and D—were “assumed” because, at the time, there wasn’t sufficiently long time-series data, especially in some of the newly independent African countries, for rigorous empirical estimation. In a recent paper, we remedy this situation by providing time-series estimates for the two elasticities for 191 countries. Using data from 1970-2018 and the vector error corrections (VEC) estimation method, we obtain estimates for 45 of the 48 Sub-Saharan African countries (including some under-studied countries like Benin, Republic of Congo, and Niger); about 47 island economies such as Fiji, Kiribati, and Marshall Islands; and seven microstates (fewer than 1000 residents and 49 hectares of land), including Nauru, Tuvalu, and Liechtenstein.
In the past, the elasticities for low-income countries were assumed to be lower than one (reflecting their lack of diversification), while those of higher income countries were set in the range of 1.5-2.0. Interestingly, the estimated elasticities follow the same pattern as the assumed elasticities. As the Figure shows, estimates of the import substitution elasticity (s) and the export transformation elasticity (W) both rise with the country’s per-capita income.
Figure: Scatter plots of the elasticities against income per capita
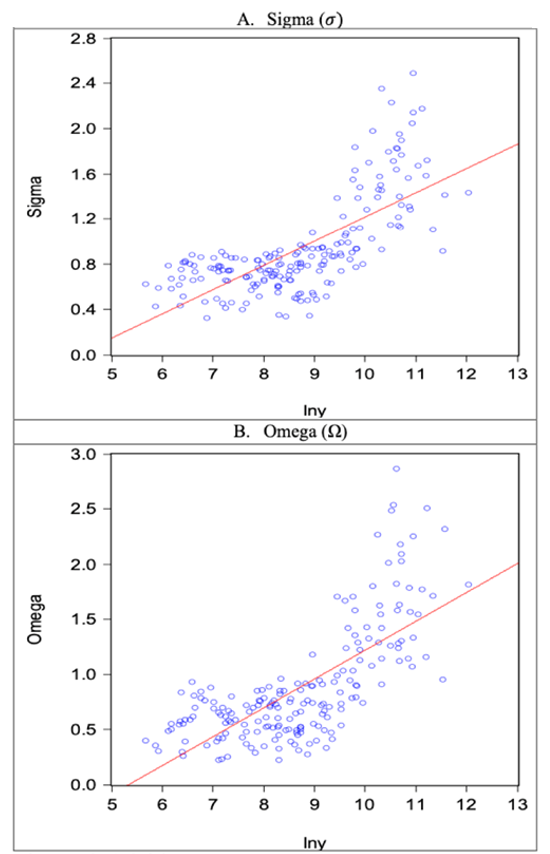
Source: Authors' calculations
Note: Iny= natural log of GDP per capita, U.S. dollars, 2015.
The averages for different country-income groups confirm the pattern of the estimated elasticities of lower-income countries being less than one and those of high-income countries close to 1.5 (Table).
Table: Average elasticities by income group
| Income group |
Import substitution (σ) |
Export transformation (Ω) |
| All developing countries |
0.707 |
0.593 |
| Low income |
0.686 |
0.566 |
| Lower middle income |
0.692 |
0.583 |
| Upper middle income |
0.731 |
0.616 |
| High income |
1.417 |
1.465 |
While we and several others have used the 1-2-3 model to undertake analyses of individual countries, some of us were uneasy with the fact that the two crucial elasticities were not based on data from that country. Now, the results in this paper can be used to better tailor the model to the country in question. In addition, as the static version of the 1-2-3 model has been calibrated for every country on an Excel spreadsheet, incorporating the estimated elasticities into this spreadsheet would permit cross-country analyses with greater precision.
Implications for policy and future research
There is often a tension in development policy debates. Policymakers ask big questions--and want the answers quickly. The policy analyst needs time to ensure that the answers have solid economic foundations and credible estimates of the relevant parameters. For a class of questions, the 1-2-3 model, which is based on general-equilibrium theory and now has its two critical parameters econometrically estimated, provides a way of resolving that tension.


Join the Conversation