The most recent World Bank
Commodity Markets Outlook forecasts commodities prices to level off next year after big gains for industrial commodities—energy and metals—in 2017. Commodity prices appear to be stabilizing after a boom that peaked in 2011, albeit at a higher average level than pre-boom.
Chart 1
We anticipate the energy price index to rise 4 percent in 2018 after a 28 percent jump this year, and metals to stabilize as a group as a decline in iron ore is offset by increases in base metals such as lead, nickel and zinc. Agriculture prices are expected to stabilize in an environment of abundant supply.

What is going on behind these forecasts? Let’s start with oil.
Chart 2
We forecast oil to average $56 per barrel in 2018, up from a $53 per barrel average this year. While members of the Organization of the Petroleum Exporting Countries and some other producers are for the most part following through on their agreement to limit production, U.S. shale producers are stepping up output, and oil-producing countries that are not bound by the OPEC accord are opening the spigots. If you compare oil prices over the last three years with in the three years before the big collapse in mid-2014, you see a new level averaging $48 per barrel, down from the pre-plunge mark of $105 per barrel.

Chart 3
U.S. shale oil production is a major reason why oil prices don’t jump when OPEC and other producers agree to limit production. U.S. shale producers have become more efficient in recent years and their technology has improved, making them profitable at ever-lower points on the oil price scale.
The cost of U.S. shale oil production has come down.
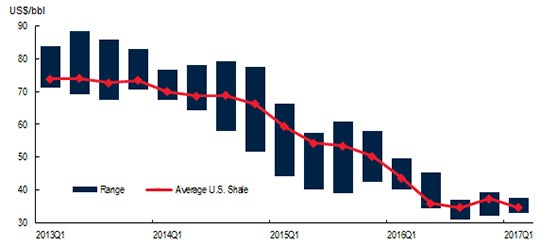
Source: Rystad Energy NASWellCube Premium.
Notes: Breakeven price is based on wellhead costs and does not include test activity, where well was shut-down after completion. Last observation is 2017Q1.
Chart 4
In the case of metals markets, China looms large. China accounts for more than half of the entire world consumption of metals, and its appetite continues to rise, while consumption by advanced and other emerging markets and developing economies has held steady.
China has become the world’s predominant metals consumer.

Source: World Bureau of Metal Statistics.
Note: Last observation is August 2017.
Chart 5
Metal prices have risen in five out of the past six quarters due to strong demand—particularly in China’s property, infrastructure, and manufacturing sectors. China has been a driver of tighter metals supply, in part due to its efforts to reduce surplus capacity by targeting old, inefficient, and polluting production facilities.

Chart 6
The World Bank’s Agricultural price index declined nearly 1 percent in the third quarter, mostly a result of well-supplied markets. Slightly higher prices across the board are expected in 2018, and only modest increases through 2020. Disruptive weather is not expected to affect prices in the near term, subsidies to producers have not skewed prices, and biofuels production, which has generated price rises in the past, is diminished.

Agriculture prices are holding steady amid abundant supplies.
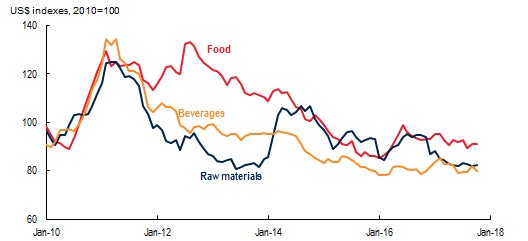
Source: World Bank.
Note: Last observation is October 2017.
Chart 7
A key reason for stable agriculture prices is an abundance of global supply. Stocks-to-use ratios, measure of how long it would take to exhaust current supplies, are at or near record highs for several grains.

Chart 8
However, favorable weather, ample supply, and low prices do not guarantee food availability everywhere. Drought conditions have caused crops failures in parts of Ethiopia, Somalia and Kenya and led to severe food shortages. Conflicts in South Sudan, Yemen and Nigeria have left millions in need of emergency food. While maize prices almost doubled in Ethiopia from January to September of this year, world prices for the same grain declined. Similarly, wheat prices increased much more in Ethiopia and Sudan than at the global level.

Despite steady world prices, drought has inflated some local prices.
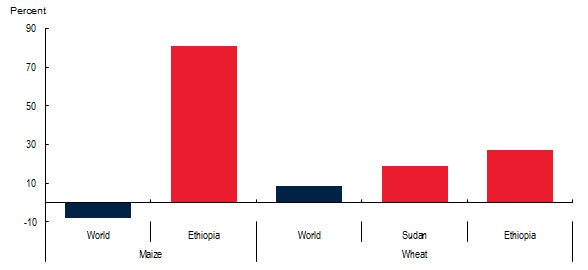
Source: World Bank, FAO.
Note: World wheat is the average of US HRW and US SRW. Domestic are averages of several markets.
Chart 9
Taking a step back, commodities indexes are expected to stabilize after a ten-year boom known as a super-cycle. The new average level for most commodities is expected to be at a slightly higher level than before the boom, however. Over the long term, agriculture and metals prices are expected to weaken in real terms, while energy prices could increase slightly.

Chart 1
We anticipate the energy price index to rise 4 percent in 2018 after a 28 percent jump this year, and metals to stabilize as a group as a decline in iron ore is offset by increases in base metals such as lead, nickel and zinc. Agriculture prices are expected to stabilize in an environment of abundant supply.

Commodity prices are expected to stabilize in 2018.
What is going on behind these forecasts? Let’s start with oil.
Chart 2
We forecast oil to average $56 per barrel in 2018, up from a $53 per barrel average this year. While members of the Organization of the Petroleum Exporting Countries and some other producers are for the most part following through on their agreement to limit production, U.S. shale producers are stepping up output, and oil-producing countries that are not bound by the OPEC accord are opening the spigots. If you compare oil prices over the last three years with in the three years before the big collapse in mid-2014, you see a new level averaging $48 per barrel, down from the pre-plunge mark of $105 per barrel.

Oil prices appear to be stabilizing at a lower level.
Chart 3
U.S. shale oil production is a major reason why oil prices don’t jump when OPEC and other producers agree to limit production. U.S. shale producers have become more efficient in recent years and their technology has improved, making them profitable at ever-lower points on the oil price scale.
The cost of U.S. shale oil production has come down.
Source: Rystad Energy NASWellCube Premium.
Notes: Breakeven price is based on wellhead costs and does not include test activity, where well was shut-down after completion. Last observation is 2017Q1.
Chart 4
In the case of metals markets, China looms large. China accounts for more than half of the entire world consumption of metals, and its appetite continues to rise, while consumption by advanced and other emerging markets and developing economies has held steady.
China has become the world’s predominant metals consumer.
Source: World Bureau of Metal Statistics.
Note: Last observation is August 2017.
Chart 5
Metal prices have risen in five out of the past six quarters due to strong demand—particularly in China’s property, infrastructure, and manufacturing sectors. China has been a driver of tighter metals supply, in part due to its efforts to reduce surplus capacity by targeting old, inefficient, and polluting production facilities.

Metals prices have risen amid strong demand and production cuts.
Chart 6
The World Bank’s Agricultural price index declined nearly 1 percent in the third quarter, mostly a result of well-supplied markets. Slightly higher prices across the board are expected in 2018, and only modest increases through 2020. Disruptive weather is not expected to affect prices in the near term, subsidies to producers have not skewed prices, and biofuels production, which has generated price rises in the past, is diminished.

Agriculture prices are holding steady amid abundant supplies.
Source: World Bank.
Note: Last observation is October 2017.
Chart 7
A key reason for stable agriculture prices is an abundance of global supply. Stocks-to-use ratios, measure of how long it would take to exhaust current supplies, are at or near record highs for several grains.

Grain supplies, gauged by stocks-to-use ratios, are near record high levels.
Chart 8
However, favorable weather, ample supply, and low prices do not guarantee food availability everywhere. Drought conditions have caused crops failures in parts of Ethiopia, Somalia and Kenya and led to severe food shortages. Conflicts in South Sudan, Yemen and Nigeria have left millions in need of emergency food. While maize prices almost doubled in Ethiopia from January to September of this year, world prices for the same grain declined. Similarly, wheat prices increased much more in Ethiopia and Sudan than at the global level.

Despite steady world prices, drought has inflated some local prices.
Source: World Bank, FAO.
Note: World wheat is the average of US HRW and US SRW. Domestic are averages of several markets.
Chart 9
Taking a step back, commodities indexes are expected to stabilize after a ten-year boom known as a super-cycle. The new average level for most commodities is expected to be at a slightly higher level than before the boom, however. Over the long term, agriculture and metals prices are expected to weaken in real terms, while energy prices could increase slightly.

Commodity prices are seen stabilizing after a boom-bust cycle.


Join the Conversation