World Bank estimates of global extreme poverty rely on many different data sources – among these are the price data that measure differences in the cost of purchasing a bundle of goods across countries. This measure of purchasing power parity (PPP) is used to ensure that the international poverty line reflects the same real standard of living across countries. Last year, the
International Comparison Program (ICP) released PPP data from 2011, the first global update since the 2005 round. The release of new PPP data has previously had significant effects on international poverty estimates. For example, when the 2005 PPP data were incorporated in Word Bank poverty estimates in 2008, the global count of poor
increased by nearly half a billion people. Since both the World Bank and United Nations have set ambitious goals for ‘ending’ extreme poverty as defined by the $1.25/day line at 2005 PPPs by 2030, massive changes in the count of poor resulting simply from using new price data would complicate the responsibility these institutions have to measure poverty, to track progress in reducing it and to explain methodological changes and statistical updates along the way.
In a recent paper on global poverty and the 2011 PPPs, we show that incorporating the 2011 PPP data will not necessarily change the count of the world’s poor as dramatically as seen in earlier revisions. Indeed, under an approach we view as maintaining a comparable poverty line with the $1.25 line at 2005 PPPs, the global poverty rate for 2011 increases by less than half a percentage point. Moreover, the path towards reducing extreme poverty to less than three percent by 2030 remains about as ambitious as indicated by projections using the 2005 PPP data. Our findings differ from early analysis and commentary which suggested that the 2011 PPP data would decrease significantly the count of poor people in the world.
Setting a comparable poverty line
The international extreme poverty line has been revised several times in the past, but has always been anchored to the principle that it should reflect the national poverty lines of the world’s poorest countries. The $1.25 line was based on the average of the national poverty lines of 15 of the poorest countries in the world, converted to USD at 2005 PPPs. We estimate that converting the value of same 15 national poverty lines (from the same countries and years) at 2011 PPPs would give an average of $1.82. An international poverty line of $1.82/day in 2011 PPPs therefore reflects the average of the same national poverty lines which gave $1.25/day in 2005 PPPs. We therefore believe this $1.82 line for 2011 is directly comparable to the $1.25 line for 2005, and, as such, can be considered a fixed benchmark for the goal of ending poverty. Nevertheless, we also note that statistical support for the $1.25 line (and hence also the re-estimated $1.82 line) is limited and prone to measurement error due to the small sample of old poverty lines on which it is based (on average, the 15 lines date from 1997). To address this, we are also working to establish more robust methods for setting a line based on a much larger sample of national poverty thresholds, for which we present some preliminary findings in our paper.
No adjustments made to the PPPs for China, India and Indonesia
In addition to updating the poverty line with the 2011 PPPs, we change one aspect of the method commonly used in poverty analysis using the 2005 PPPs. Chen and Ravallion (2010) argue that the 2005 PPPs required rural-urban adjustments for China, India and Indonesia. This was done for good reasons. For example, it was noted that the 2005 ICP survey in China was confined to only 11 cities and therefore the 2005 PPP were considered to be an urban PPP index for China. To correct for this, the ratio of urban to rural national poverty lines is used to provide a scaling factor to scale rural consumption such that it is expressed in urban price levels. Similar adjustments were done for India and Indonesia.
The 2011 ICP claims to have achieved a much better coverage of rural areas than the 2005 round, and we therefore argue that the adjustments based on the 2005 data are not valid for use with the 2011 PPP data. We use the 2011 PPPs without any such adjustments. This is in contrast to initial analyses mentioned above, and a recent working paper from CGD, which leaves in the country-specific 2005-adjustments for China, India and Indonesia. More work is ongoing to assess the sampling of the 2011 PPPs, which may lead to revisions to how the PPPs are adjusted for rural-urban price differences and biases in data collection, but we believe the estimates in our paper based on the face value 2011 PPP data serve as an important input the this discussion.
Still one billion poor people and an ambitious goal
How would adopting these lines and the 2011 PPPs change the global picture of current and future extreme poverty? Our estimate suggests that with the $1.82 line and the 2011 PPPs, the global poverty rate would be 14.9% (1.04 billion people) in 2011, very close to the 14.5% reported by the 2005 PPPs and the $1.25 line. Our projections also suggest that the differences remain small for the World Bank’s (highly uncertain) poverty forecasts for 2030. Our replications of the poverty projections published in the 2015 Policy Research Report, suggest that the most optimistic forecast of poverty rate in 2030 is 4.3% for the $1.82-line, not much below the 4.7% suggested by projections based on the 2005 PPPs. While the global estimates are quite similar, the relative concentration of extreme poverty across regions does change more significantly. Despite this shift in current regional profiles of poverty, over all projections for 2030 we consider, sub-Saharan Africa will be the region with the vast majority (close to 90%) of the world’s poor. The trajectories and regional profiles are summarized in the figures below.
We do not wish to underplay that the 2011 PPPs lead to relatively substantial changes to international poverty estimates for individual countries, although these are on average much smaller than the large revisions caused by the introduction of the 2005 PPPs. But, for country-level analysis, it is important for analysts and policy makers to recall that national poverty numbers and profiles based on each country’s own national poverty line are more appropriate to inform policy and country-level dialogues. In some ways, this is similar to the issue faced by medical practitioners and epidemiologists – some health indicators are useful for measuring over large populations, but can perform poorly for individual-level diagnosis. The global poverty line is a useful tool for aggregating the number of poor people around the world, but for a country-specific count, the analyst is better served by using a national poverty line that better reflects the country-specific context.
Finally, our analysis does not reflect official poverty estimates from the World Bank, but suggests that forthcoming official revisions to the numbers based on the 2011 PPPs estimates may be smaller than those suggested by commentators immediately after the release of the 2011 data. The World Bank is aiming to resolve the remaining data issues and finalize the update to the value of the global poverty line during the next few months. The final estimates will be ready by early September and will be published as part of the Global Monitoring Report to be released at the October 2015 Annual Meetings in Lima. Our analysis suggests that the new price data does not drastically alter the global level of extreme poverty and that ending it by 2030 remains a highly ambitious goal.
Jolliffe, Dean; Prydz, Espen Beer. 2015. Global poverty goals and prices: how purchasing power parity matters . Policy Research working paper no. WPS 7256. Washington, D.C.: World Bank Group.
In a recent paper on global poverty and the 2011 PPPs, we show that incorporating the 2011 PPP data will not necessarily change the count of the world’s poor as dramatically as seen in earlier revisions. Indeed, under an approach we view as maintaining a comparable poverty line with the $1.25 line at 2005 PPPs, the global poverty rate for 2011 increases by less than half a percentage point. Moreover, the path towards reducing extreme poverty to less than three percent by 2030 remains about as ambitious as indicated by projections using the 2005 PPP data. Our findings differ from early analysis and commentary which suggested that the 2011 PPP data would decrease significantly the count of poor people in the world.
Setting a comparable poverty line
The international extreme poverty line has been revised several times in the past, but has always been anchored to the principle that it should reflect the national poverty lines of the world’s poorest countries. The $1.25 line was based on the average of the national poverty lines of 15 of the poorest countries in the world, converted to USD at 2005 PPPs. We estimate that converting the value of same 15 national poverty lines (from the same countries and years) at 2011 PPPs would give an average of $1.82. An international poverty line of $1.82/day in 2011 PPPs therefore reflects the average of the same national poverty lines which gave $1.25/day in 2005 PPPs. We therefore believe this $1.82 line for 2011 is directly comparable to the $1.25 line for 2005, and, as such, can be considered a fixed benchmark for the goal of ending poverty. Nevertheless, we also note that statistical support for the $1.25 line (and hence also the re-estimated $1.82 line) is limited and prone to measurement error due to the small sample of old poverty lines on which it is based (on average, the 15 lines date from 1997). To address this, we are also working to establish more robust methods for setting a line based on a much larger sample of national poverty thresholds, for which we present some preliminary findings in our paper.
No adjustments made to the PPPs for China, India and Indonesia
In addition to updating the poverty line with the 2011 PPPs, we change one aspect of the method commonly used in poverty analysis using the 2005 PPPs. Chen and Ravallion (2010) argue that the 2005 PPPs required rural-urban adjustments for China, India and Indonesia. This was done for good reasons. For example, it was noted that the 2005 ICP survey in China was confined to only 11 cities and therefore the 2005 PPP were considered to be an urban PPP index for China. To correct for this, the ratio of urban to rural national poverty lines is used to provide a scaling factor to scale rural consumption such that it is expressed in urban price levels. Similar adjustments were done for India and Indonesia.
The 2011 ICP claims to have achieved a much better coverage of rural areas than the 2005 round, and we therefore argue that the adjustments based on the 2005 data are not valid for use with the 2011 PPP data. We use the 2011 PPPs without any such adjustments. This is in contrast to initial analyses mentioned above, and a recent working paper from CGD, which leaves in the country-specific 2005-adjustments for China, India and Indonesia. More work is ongoing to assess the sampling of the 2011 PPPs, which may lead to revisions to how the PPPs are adjusted for rural-urban price differences and biases in data collection, but we believe the estimates in our paper based on the face value 2011 PPP data serve as an important input the this discussion.
Still one billion poor people and an ambitious goal
How would adopting these lines and the 2011 PPPs change the global picture of current and future extreme poverty? Our estimate suggests that with the $1.82 line and the 2011 PPPs, the global poverty rate would be 14.9% (1.04 billion people) in 2011, very close to the 14.5% reported by the 2005 PPPs and the $1.25 line. Our projections also suggest that the differences remain small for the World Bank’s (highly uncertain) poverty forecasts for 2030. Our replications of the poverty projections published in the 2015 Policy Research Report, suggest that the most optimistic forecast of poverty rate in 2030 is 4.3% for the $1.82-line, not much below the 4.7% suggested by projections based on the 2005 PPPs. While the global estimates are quite similar, the relative concentration of extreme poverty across regions does change more significantly. Despite this shift in current regional profiles of poverty, over all projections for 2030 we consider, sub-Saharan Africa will be the region with the vast majority (close to 90%) of the world’s poor. The trajectories and regional profiles are summarized in the figures below.
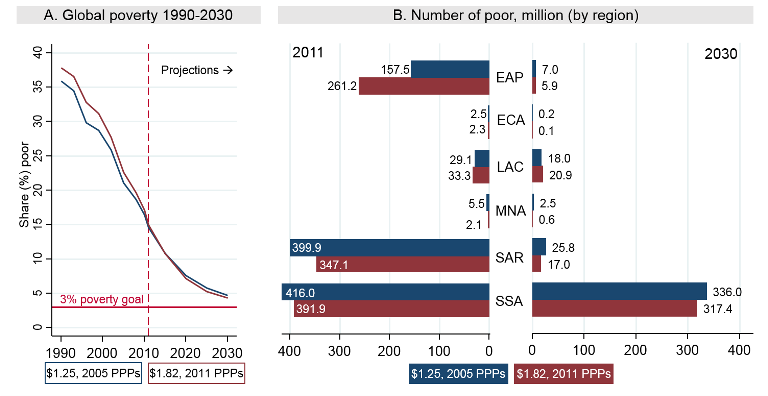
Note: Panel (A) shows the trajectory for global poverty from 1990 to 2030 for both the $1.82 line at 2011 PPPs and 1.25 line at 2005 PPPs. Estimates from 2012 onwards are assuming 10 year country-specific per capita growth rates, with no changes to inequality. Panel (B) shows the estimates for the number of poor in 2011 and 2030 across World Bank Regions. EAP: East Asia and the Pacific; ECA: Europe and Central Asia; LAC: Latin America and the Caribbean; MNA: Middle East and North Africa; SAR: South Asia; SSA: Sub-Saharan Africa.
We do not wish to underplay that the 2011 PPPs lead to relatively substantial changes to international poverty estimates for individual countries, although these are on average much smaller than the large revisions caused by the introduction of the 2005 PPPs. But, for country-level analysis, it is important for analysts and policy makers to recall that national poverty numbers and profiles based on each country’s own national poverty line are more appropriate to inform policy and country-level dialogues. In some ways, this is similar to the issue faced by medical practitioners and epidemiologists – some health indicators are useful for measuring over large populations, but can perform poorly for individual-level diagnosis. The global poverty line is a useful tool for aggregating the number of poor people around the world, but for a country-specific count, the analyst is better served by using a national poverty line that better reflects the country-specific context.
Finally, our analysis does not reflect official poverty estimates from the World Bank, but suggests that forthcoming official revisions to the numbers based on the 2011 PPPs estimates may be smaller than those suggested by commentators immediately after the release of the 2011 data. The World Bank is aiming to resolve the remaining data issues and finalize the update to the value of the global poverty line during the next few months. The final estimates will be ready by early September and will be published as part of the Global Monitoring Report to be released at the October 2015 Annual Meetings in Lima. Our analysis suggests that the new price data does not drastically alter the global level of extreme poverty and that ending it by 2030 remains a highly ambitious goal.
Jolliffe, Dean; Prydz, Espen Beer. 2015. Global poverty goals and prices: how purchasing power parity matters . Policy Research working paper no. WPS 7256. Washington, D.C.: World Bank Group.


Join the Conversation