 It’s 1988. I’ve just started my career as a statistician in the British Civil Service. One of my first tasks: find data to compare the major aid donors of the world: how much they give, and the size of their economies.
Today, it seems an almost trivial task. There are plenty of good on-line resources and tools, like the OECD’s aid statistics website, the new AidFlows tool, and the Bank’s own data website.
But twenty three years ago there isn’t a computer on every desk. There is no internet, no World Wide Web. So no email, no instant messages, no Google. Communication is by letter (in quintuplicate, I should add), fax, phone – and more than an occasional telex. And getting hold of some data means spending a few happy hours in the statistical annex of the departmental library, digging out the latest statistical publications.
There were actually plenty to go at. The statistical reference tables of the OECD’s Development Assistance Committee provided – and still provide – the authoritative resource on aid volumes. But when it came to finding data to compare the size of economies, easily the most accessible and usable resource was the World Bank Atlas.
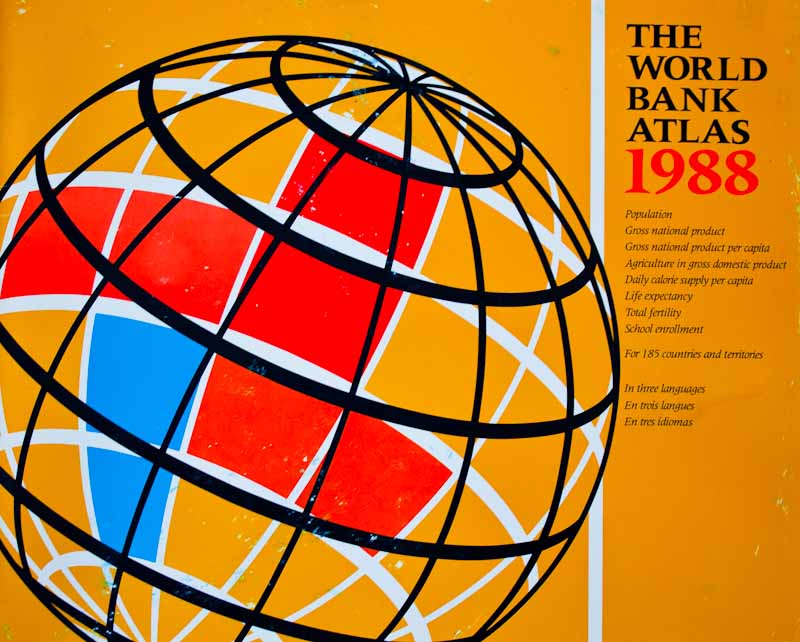
The 1988 World Bank Atlas was the twenty first edition in the series, but it had something new: for the first time, the Atlas reported that in 1987 Italy had a higher Gross National Product than the United Kingdom: US$597 million to US$593 million, using the Atlas method for converting the data from Pounds and Lira to US dollars. I remember breaking this news to colleagues and superiors. Surely, they said – perhaps thinking how they themselves would break this news to Ministers – that can’t be right? You must have copied the data wrongly! Isn’t there some other indicator we can use? Somewhat luckily for them, the UK was still ahead of Italy if you looked at the data in per capita terms. Though only by ten dollars - for 1987, Italy was estimated to be $10,420, with UK at $10,430.
Of course, that was then, and now is now. Times have changed. Perhaps sadly, many researchers no longer get to experience the pleasures of statistical libraries. And the World Bank Atlas – now in its 45th year – has also moved with the times. This week sees the publication of the latest version, which, like the previous two editions, has a new name and a new format: the Atlas of Global Development. The format has more analysis of the data, more maps, and more graphs. And – for the first time – a free new companion on-line electronic version – helps readers understand the world and development progress using some neat visualization tools. Go take a look. You won’t even need to leave your desk!


Join the Conversation