 Da Nang, Vietnam: Aerial view of Son Tra peninsula which is one of the most beautiful destination of Da Nang
For policymakers, answering these questions in near-real time is difficult due to the delay in gathering economic, social, and financial information through conventional means. The availability of “big data for good,” however, can be a game changer for monitoring pandemic response. Large technology companies have made available human mobility data that makes it possible to monitor the impact of the COVID-19 interventions in near real-time worldwide. In this blog, we will illustrate the use of this data to measure impact here in Vietnam, which was recently hit by a second wave of COVID-19 infections.
On July 24, after 99 days of zero community-transmitted COVID-19 infections, a 57 year-old man tested positive in Danang, a major city in central Vietnam with close to 1.5 million inhabitants. Within three weeks, almost 600 people were infected, over 25 deaths recorded. Most of these cases remained concentrated in and around Danang. Authorities were quick to respond to the outbreak: the city was swiftly shut down with an estimated 80,000 tourists evacuated, most hotels and businesses closed, and nearly all domestic and international flights cancelled. Importantly, this approach differed from the policy in April, when a state of emergency was adopted nationwide for three weeks. This time in Danang, Vietnamese authorities opted to implement a strict but localized lockdown instead.
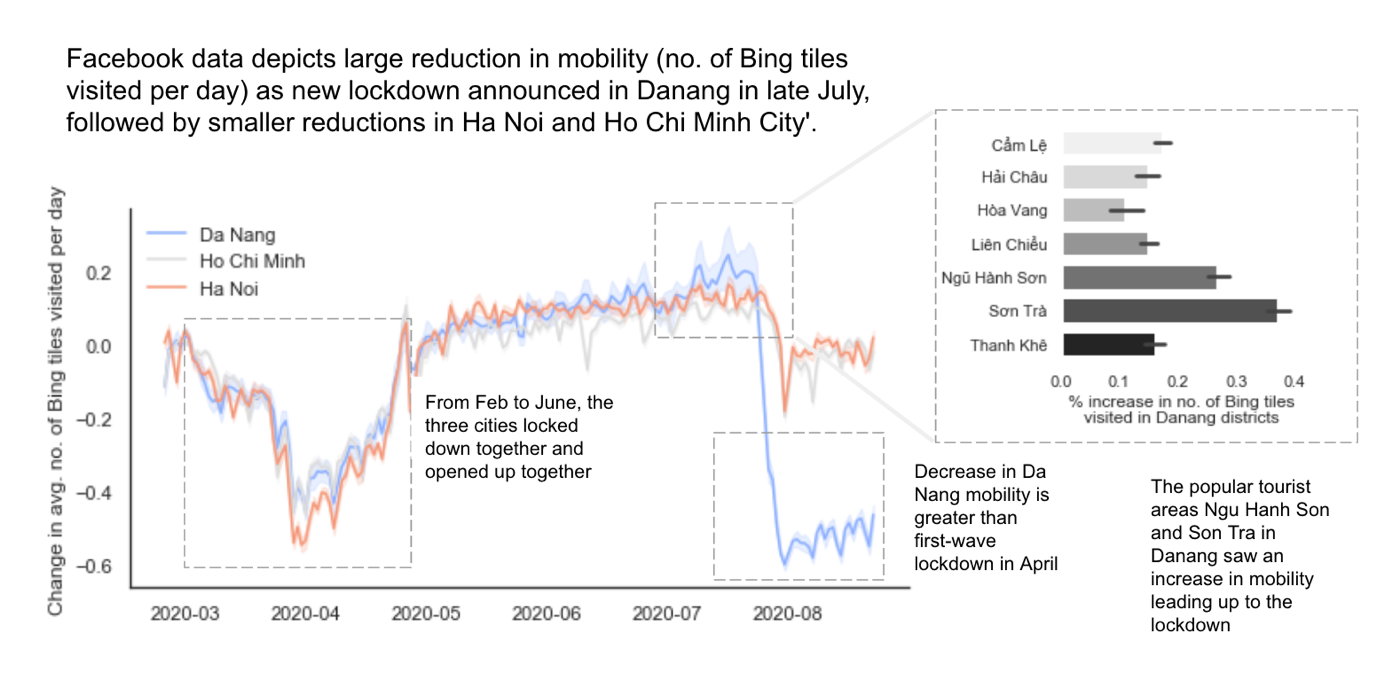
Both Facebook and Google data enable us to measure the impact of these local containment policies on movement. Location-based data provided by Facebook’s “Disease Prevention Maps” is provided at 8-hourly intervals in map squares as small as 600x600 meters. The data also enables us to measure changes in the number of tiles visited per day. The idea is as follows: if the number of tiles visited per day decreases, we then take this as a proxy for decreased mobility. In Figure 1 we see two “dips” with the August Danang lockdown causing a greater and sharper decline than the national lockdown in April. For the first time, the pattern in Danang has diverged from that in Ha Noi and Ho Chi Minh City (HCMC); this was not the case in preceding months, where changes in all three cities occured uniformly.

Source: Facebook Disease Prevention Maps.
Figure 1. Changes in Danang, Ho Chi Minh City, and Ha Noi from March to August 2020
Source: Google Community Mobility Reports.
Figure 2. Changes in visits to categories of interest, averaged across the month of August 2020, relative to a baseline established between Jan 3–Feb 6, 2020
Data from Google Community Mobility Reports confirms this finding. This data computes percentage change in visits to places such as grocery stores, workplaces, residential locations, transit stations, retail/recreation, and parks. While this data is only available at the city level at a daily cadence, it has the advantage of labeling change by type of location. Consistent with Facebook data, in Danang, we find that following the second wave of infections in August, the decline in visits to all types of locations diverged from Ha Noi and HCMC. Visits to all types of locations decreased, except for residential locations.
From this analysis, we observe that more localized lockdown has led to a more rapid and efficient curtailment of movement, compared to the national lockdown. This enables Vietnam to both limit the economic impact and a possible spread of contagion, as well as to potentially reopen faster than it would from a national lockdown. A recent IMF study estimates that containment measures have had a very large impact on economic activity globally—equivalent to a 15% loss in industrial production over a 30-day lockdown period. In the case of Vietnam, industrial and retail data also dipped by almost 15% during the national lockdown in April, while almost ¾ of households indicated being affected economically. Therefore, by adopting measures that do not reduce mobility in the country’s main economic hubs such as Hanoi and HCMC, authorities may be able to circumvent the economic impact beyond Danang.
Continued resurgences of COVID-19 infections have amplified the need for just-in-time policy responses. Big data offers the opportunity for governments to monitor and evaluate the impact of their policies almost in real time, iterating and refining measures adaptively . The Vietnam COVID-19 Big Data Observatory brings together big data sources including mobility data and proxies for economic activity, such as nightlights, NO2, and flight data. The modular data feed applications are available for additional countries for East Asia and Pacific and beyond, with an emphasis of allowing users to interpret data for sub-national levels, thereby serving to promote awareness and application of these types of resources by colleagues and counterparts alike who can therefore develop policy responses to COVID-19 that will help save lives and jobs in Vietnam and beyond.
This blog is part of the effort by the World Bank in Vietnam to use big data for good in the COVID-19 context. This effort is funded by the Australian Department of Foreign Affairs and Trade (DFAT).
Thanks to the Development Data Partnership (https://datapartnership.org/) for facilitating access to the Facebook data.


Join the Conversation