The coronavirus pandemic has taken a severe human and economic toll on the East Asia and Pacific region (EAP). Regional growth is projected to slow sharply in 2020, to 0.5 percent—the lowest rate since 1967 —reflecting the impact of pandemic-related lockdowns, tighter financing conditions, and a deep contraction in exports. Sizable policy support will prevent a more severe deceleration. Although subject to significant uncertainty, regional growth is expected to rebound to 6.6 percent in 2021 as the pandemic subsides, global import demand recovers, and capital flows to the region normalize. However, the balance of risks to the outlook is firmly tilted to the downside. Key risks include a longer-than-expected duration of the pandemic, a prolonged period of heightened financial stress, and a sharper- and longer-than-expected contraction in global trade compounded by re-escalating trade tensions.
[Download: Global Economic Prospects, June 2020 – Pandemic, Recession: The Global Economy in Crisis]
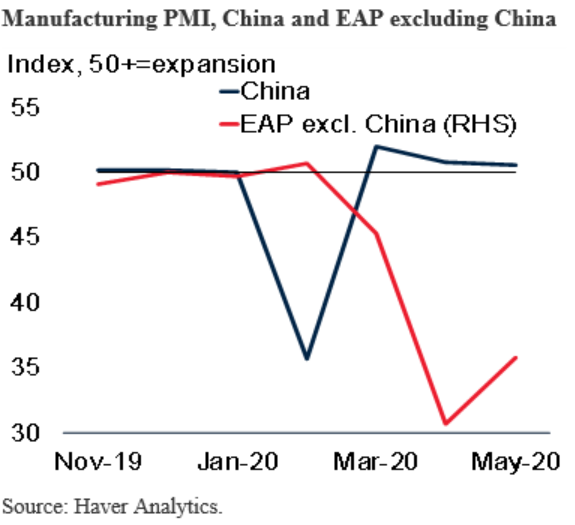
1. Following a collapse in 2020Q1, China’s output has bottomed out
In China, where highly restrictive measures led to an almost complete halt in activity in some sectors and regions in February, output is estimated to have contracted by 34 percent q/q, saar in the first quarter—the first contraction since 1976. Activity started to recover in early March as the domestic lockdown was relaxed. As of April, industrial production has returned to growth and vehicles sales posted the first increase since June 2018.

2. In the rest of the region, economic conditions deteriorated in March and remained stressed until mid-2020Q2 reflecting national lockdowns and negative spillovers from the rest of the world
Factory closures and the disruption of the production of intermediate inputs have had a negative impact on supply chains in Cambodia, Malaysia, Myanmar, and Thailand. Domestic restrictions and external spillovers have resulted in a dramatic plunge in consumption, investment, production, and trade flows, leading to the sharpest fall in activity since the Asian financial crisis for most countries. Activity in the region excluding China bottomed out in mid-2020 as domestic lockdowns eased.
3. All major regional economies have implemented large macroeconomic policy support to mitigate the economic impact of the outbreak
In China, the People’s Bank of China has provided substantial liquidity support, cut policy rates, and lowered reserve requirements to stem market sell-offs and support businesses. Other regional economies have also cut monetary policy rates, provided liquidity and credit facilities, and embarked on various asset purchase programs (Indonesia, Malaysia, the Philippines, Thailand).
Key fiscal policy measures in China included emergency health spending, tax breaks, direct transfers to vulnerable households, and deferrals and special local government bond issuances to boost investment, totaling 5.4 percent of GDP. Malaysia and Thailand have both implemented extraordinary economic support packages equivalent to around 17 percent and 13 percent of GDP respectively, which included direct fiscal stimulus packages around 6 percent of GDP in both countries focused on public welfare and health care provision, loan guarantees, and other business support initiatives. Indonesia and the Philippines have announced sizable fiscal stimulus packages ranging around 3-5 percent of GDP.

4. Regional GDP growth in 2020 is projected to fall to 0.5 percent—down from 5.9 percent in 2019, 5.2 percentage points below January forecasts, and the lowest rate since 1967. Regional growth is expected to rebound to above its trend pace, to 6.6 percent in 2021, as lockdowns are lifted around the world
Regional GDP growth in 2020 is projected to fall to 0.5 percent—down from 5.9 percent in 2019, 5.2 percentage points below previous forecasts, and the lowest rate since 1967. Regional growth is expected to gradually recover during the second half of 2020 and return to around trend by late 2021. Growth in China is projected to slow to 1 percent in 2020—4.9 percentage point below January forecast and the lowest rate since 1976—reflecting the significant disruptions caused by COVID-19, and then rebound above its trend pace, to 6.9 percent in 2021. Growth in EAP excluding China is projected to contract by 1.2 percent in 2020—the first contraction since the 1998 Asian financial crisis—and then rebound to 5.4 percent in 2021 as the effects of the virus dissipate.
The pandemic will likely further slow potential growth in the region by weakening investment and the supply chains that have been an important conduit for productivity gains over the past decade. The negative impact is expected to be broad-based and will add to the long-term slowdown from deteriorating demographic trends and falling growth in total factor productivity.

5. However, the balance of risks to the outlook is firmly tilted to the downside. Vulnerabilities among some EAP countries could amplify the impact of repeated sudden stops in capital flows or a rise in borrowing costs
There are multiple risks to the outlook, including a longer-than-expected duration of the pandemic, a prolonged period of heightened financial stress, and a sharper- and longer-than-expected contraction in global trade compounded by re-escalating trade tensions. Should the downside risks to the outlook materialize, the regional economy could contract by 1.9 percent in 2020, and growth will remain below trend in 2021.
In some dimensions, major EAP economies appear to be better equipped to cope with this crisis than in the past. They have a strong track record of growth, greater exchange rate flexibility, and more robust monetary, prudential, and fiscal policy frameworks. Indeed, the increase in borrowing costs in EAP has been generally less pronounced than in other emerging market and developing regions reflecting robust monetary, prudential, and fiscal policy frameworks in major regional economies. However, vulnerabilities among some EAP countries could amplify the impact of repeated sudden stops in capital flows or a rise in borrowing costs. These include elevated debt (China, Lao PDR, Malaysia, Mongolia, Vietnam); sizable fiscal deficits (Lao PDR, Vietnam); and heavy reliance on volatile capital flows (Cambodia, Indonesia); considerable foreign holdings of domestic debt (Indonesia, Malaysia, Thailand). Achieving long-term sustainable development calls for debt overhangs to be addressed and excessive leverage to be avoided.
On the upside, a gradual normalization of global trade relations remains a possibility, notwithstanding new challenges, and pandemic containment and economic policy support measures in major regional economies could be more effective than expected, leading to sustained recovery of regional growth.


Join the Conversation