Collecting data in education can be a tricky business. After spending considerable resources to design a representative study, enlist and train data collectors, and organize the logistics of data collection, we want to ensure that we capture as true a picture of the situation on the ground as possible. This can be particularly challenging when we attempt to measure complex concepts, such as child development, learning outcomes, or the quality of an educational environment.
Data can be biased by many factors. For example, the very act of observation by itself can influence behavior. How can we expect a teacher to behave “normally” when outsiders sit in her or his classroom taking detailed notes about everything they do? Social desirability bias, where subjects seek to represent themselves in the most positive light, is another common challenge. Asking a teacher, “Do you hit children in your classroom?” may elicit an intense denial, even if the teacher still has a cane in one hand and the ear of a misbehaving child in another.

Data collectors’ and test reliability are less-discussed sources of bias that can also negatively impact a study. We tend to discount individual personalities of those collecting data–we assume that it doesn’t matter if Priscilla or Oliver conduct an assessment, since we believe that both would faithfully record the same information. However, with field experiments in education in general and learning assessments in particular, this isn’t the case. In fact, two individuals can paint strikingly different pictures of the quality of a lesson or a child’s developmental level.
Signs of bias
‘Inter-rater reliability’ (IRR) is how likely two data collectors are to agree when scoring responses. For example, an assessment about vocabulary may involve showing a child 20 flashcards to identify. If two enumerators observing the activity perfectly agree on both the correct and incorrect responses, the IRR is one or 100%. If they disagree on all twenty responses, the IRR is zero. Low IRR is an important sign of a biased study, poorly trained collectors, or a subjective and inaccurate tool.

Collecting data
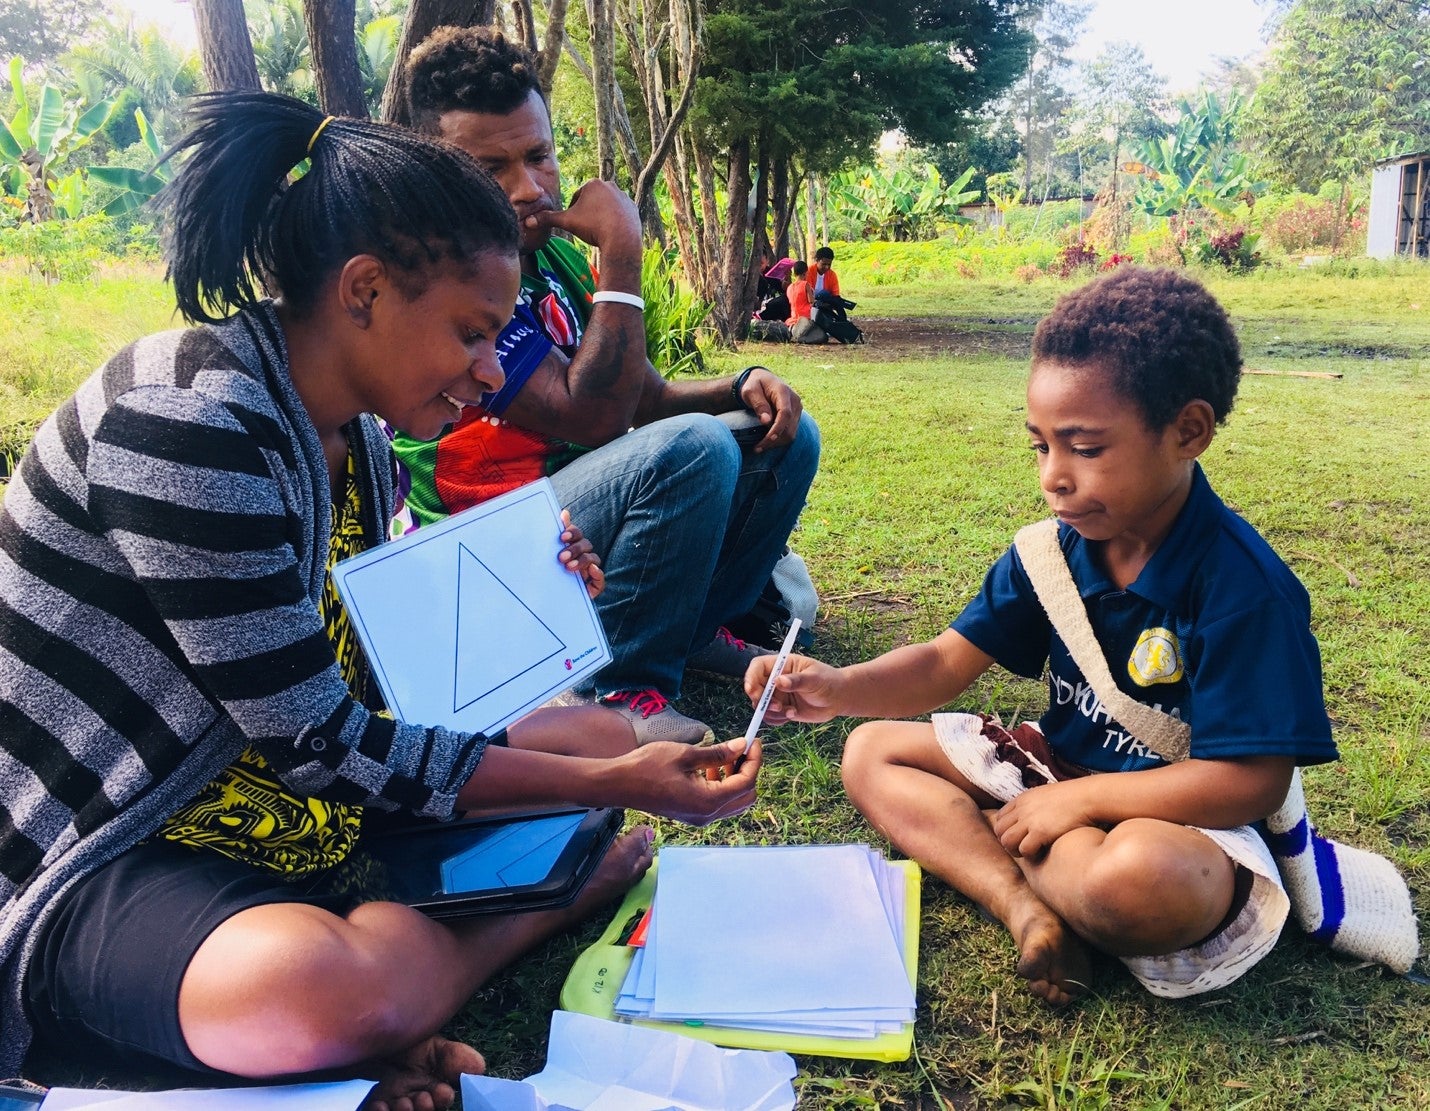
We can easily collect IRR data during a pilot by having collectors work in pairs. One of them administers the assessment as normal, interacting with the child and scoring the responses. The other listens quietly and scores the assessment without engaging with either the child or the other collector. Subsequently, we can analyze the paired data and discuss the results with them. If there are conceptual gaps in the understanding of certain questions or sub-sections, these are likely to come up during a debrief as multiple pairs disagree on the same question.
Figure 1. A basic table showing disagreements between data collectors assessing number identification

It is also best practice to collect IRR data throughout a study. We can measure data collectors’ reliability by having the lead collector randomly pair collectors to double-assess 10% of children each day (for example, for the first and 11th child in a randomly selected list of 20 children from a school). Having such data allows us to measure data collector bias at a system level throughout the assessment.
While the exercise of sifting through pairs of scores is useful, there are times when we wish to generalize when exploring the validity of a tool. There are several ways to quantify the inter-rater reliability ranging from a simple “percent agreement” to taking the intra-class correlation of ratings of the same subject.
Though human bias can never be completely eradicated, we can take steps to diminish its effects :
- Have a highly scripted assessment with clear and easy-to-follow guidance for scoring and ensure data collectors have sufficient training. Guidance with less ambiguity and subjective interpretation reduces variability in scoring. Also, reviewing IRR data from pilot testing during the tool training helps identify and clarify difficult-to-score questions.
- Randomly assign subjects to data collectors and sites to teams. We should distribute treatment and control schools equally between teams so that, on average, results aren’t biased due to collector team effects. If a particular person is ‘generous’, having them assigned solely to treatment or control schools could systematically bias results.
- Remind individuals collecting data that they aren’t there to teach the children. They are not doing a favor to the child or the school by being generous in their grading or using the assessment as an opportunity to learn.
Even when our IRR is high, other sources of bias may remain. Children may respond differently when being assessed by a younger or older individual, or by a male or female. By eliminating the “low-hanging fruit” of poor IRR, we can quite significantly improve the accuracy of our estimates and our confidence in the results and validity of our research.
Find out more about World Bank Group Education on our website and on Twitter.


Join the Conversation