Statistics. Either you love or hate them. We certainly need them to compare and measure data, as well as to make informed decisions. Here at the World Bank, we often get calls from researchers, students and journalists asking for education data: Is there an increase in the number of tertiary education students in Brazil in 2017? How much are governments in South Asia spending on education? Where can we find a database of World Bank education projects?
We try to help answer these, as much as we can, but a quicker and easier way of finding this data is to visit the World Bank’s revamped EdStats website. EdStats – the World Bank’s portal for accessing education-related data – has been around since 1998 and is one of the most used websites by education specialists at the World Bank and partner organizations. User feedback has been highly positive: the interface looks neater, highly mobile and tablet-friendly. Allow me to give you a “tour” of the revamped website.
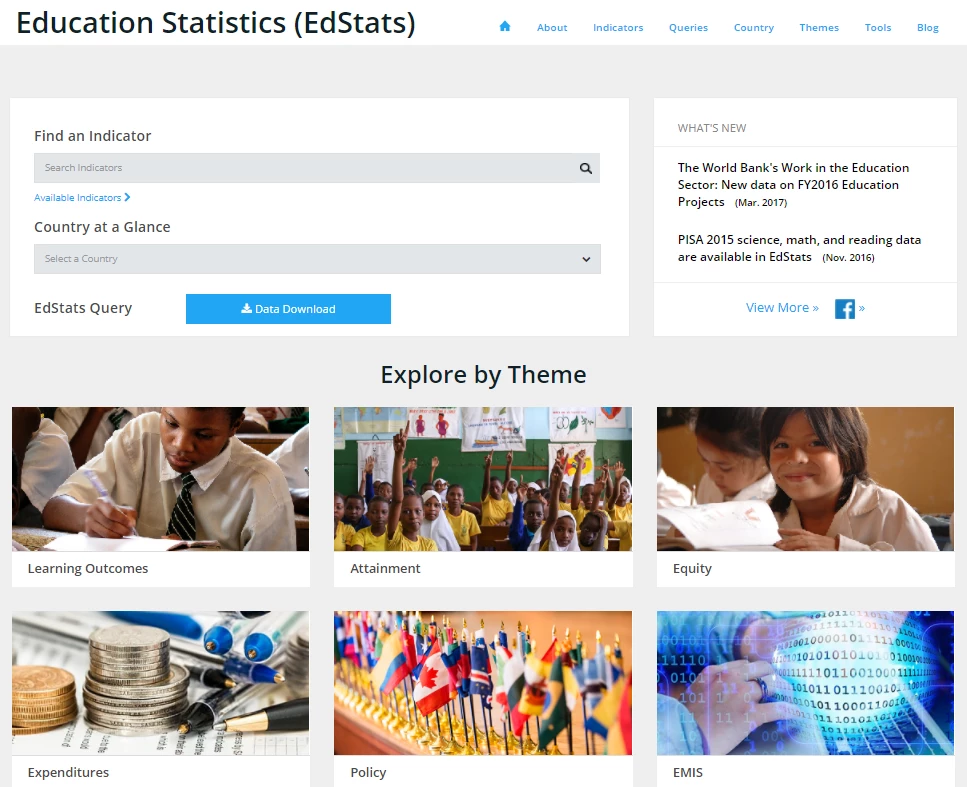
Search Bars. The top section of the interface allows users to collect data at a more specific scope. This is especially beneficial for those who already have a particular indicator or country in mind. By typing on the search bars, users can generate the data based on a specific indicator or country and now they even have the option to keep the data by clicking on the “Data Download” button.
Thematic Buttons. The revamp also offers buttons where data can be found under different themes:- Learning Outcomes. Highlights student learning levels in reading, mathematics, and science in over 100 countries based on data from international and regional learning assessments.
- Attainment. Illustrates the distribution of education attainment and human capital from 1970 to 2010 by countries, time periods, and age groups.
- Equity. Presents detailed information on gender, income, and geographic inequalities in education access, completion, and attainment.
- Policy. Evaluates the quality of education policies against evidence-based global standards, producing comparative data and knowledge on education policies and institutions.
- Expenditures. Two databases compare expenditure data across countries and provide data on a country-by-country basis.
- EMIS (Education Management Information Systems). Provides systematic, quality data in project planning and policy dialogue.

Why it matters
Using EdStats, practitioners can easily identify issues, gaps, successes, and cross-country comparisons that are categorized along thematic lines. Here are some additional ways it can provide support across topics:
- Highlights a country’s strengths and issue areas. The “Country at a Glance” feature allows users to zoom in on the state of a country’s education system. From this information, users can extract specific data, discover active World Bank projects, and learn more about the country’s socio-economic context.
- Simplifies complex data through graphics. The dashboards use Tableau technology and other data visualization methods to highlight correlations and linkages between education indicators.
- Creates opportunities to garner strategic, comparative analyses. By delving into six thematic categories, comparisons can easily be made across countries, regions, and income levels.
- Identifies trends over time. EdStats allows users to identify growing and declining trends over time, which can be utilized to map analyses and identify inroads for strategic programming.
- Links policy to outcomes. EdStats maps policies to easily identify which have been successful, which haven’t, and which to prioritize moving forward.
EdStats is integrated into the World Bank’s open data, which means education data is linked to other sectors such as health, social protection, agriculture, and transportation. As mentioned in a previous blog on EdStats, this portal uses data from external sources – UNESCO’s Institute for Statistics, household surveys (DHS, MICS, LSMS), international student assessments (PISA, PIAAC, TIMSS, PIRLS), and regional and national student assessments (SAQMEC, PASEC, LLECE, EGRA/EGMA) – to provide a holistic picture of the education landscape. It is designed to easily download indicators and map them based on project needs.
Looking ahead
The World Bank Education team hopes the revamped EdStats site will make it easier to utilize education statistics in country dialogue. The site’s update aims to transform traditional, static data to something that is more dynamic and useful for policymakers.
Please visit the site and let us know what you think. We look forward to hearing your suggestions on how to make it more relevant to your needs. To learn more about EdStats, please contact habdulhamid@worldbank.org.
Find out more about World Bank Group Education on our website and on Twitter.


Join the Conversation