Blog #2: On poverty and prosperity, lot done, lot to do
India is home to the largest number of poor people in the world, as well as the largest number of people who have recently escaped poverty. Over the next few weeks, this blog series will highlight recent research from the World Bank and its partners on what has driven poverty reduction, what still stands in the way of progress, and the road to a more prosperous India.
We hope this will spark a conversation around #WhatWillItTake to #EndPoverty in India. Read all the blogs in this series, we look forward to your comments.
The rapid decline in India’s poverty levels in the recent decade augurs well for the country’s efforts to eradicate poverty. Though the decline was faster and more broad-based than in the preceding decades, examples from across the developing world suggest it could have been more inclusive and responsive to economic growth.
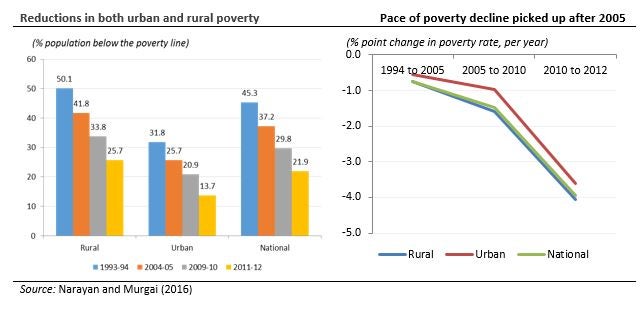
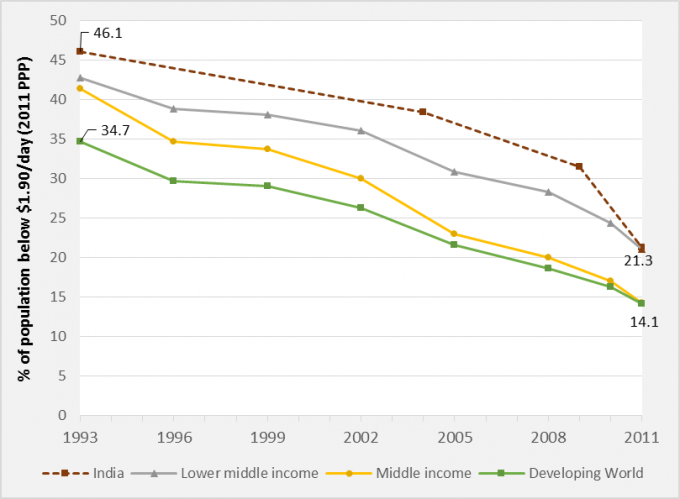
India has made tremendous progress in reducing absolute poverty in the past two decades. The standard way to determine whether a household is poor is to compare its daily expenditure per capita to a minimum consumption threshold, or poverty line. Based on India’s official line, the share of the population living in poverty was halved between 1994 and 2012, falling from 45 percent to 22 percent (figure). During this period, an astonishing 133 million people were lifted out of poverty. Moreover, the pace of poverty reduction accelerated over time and was three times faster between 2005 and 2012 - the years for which the latest set of government data are available - than in the previous decade. At this pace, the fall in extreme poverty in India since 2005, pegged at $1.90 a day, 2011 PPP, matched or exceeded the average rate of decline for the developing world as a whole and the middle-income countries as a group.


Figures are available at roughly 3-year intervals during 1990-2008; for India, actual survey years are used.
Source: World Development Indicators (accessed on November 16, 2015)
However, poverty reduction did not benefit all segments of the population equally. The fall in poverty levels could have been much higher if growth had been more inclusive. Notably, while consumption levels have increased rapidly in recent years, the poorest 40 percent of households have seen their incomes grow at a slower pace than the population as a whole. On this measure of ‘shared prosperity’ – or equitable improvement among all people - India lags behind countries at a similar stage of development. Although India ranked 16th among 51 middle income countries in average consumption growth during 2005-2012, it ranked much lower - 27th - in consumption growth for the poorest 40 percent during this period.
In many cases, when a country experiences high growth, rapid poverty reduction quickly follows. In India’s case, however, high growth did not lead to as quick a decline in poverty as we would have expected. The responsiveness of poverty to per capita GDP growth in India is lower than the average for developing countries. A few telling indicators reveal the extent of this divergence: while India ranked in the top 10 percent of developing countries in per capita GDP growth during 2005-2012, it featured just above the 60th percentile in the rate of poverty reduction during this period. And, in general, this relationship between growth and poverty reduction varied widely between states.
The sheer scale of poverty in the country remains sobering. In 2012, India was home to 262 million poor (as defined by the $1.90 per day international poverty line). Put differently, one in four people living in extreme poverty across the world are Indians.[1]
Poverty is closely inter-twined with geography. The poor are still far more likely to be found in India’s villages which are home to 80 percent of the country’s poor. Moreover, the poorer states are not catching up with their more prosperous counterparts. If the current trend of slower poverty reduction in the poorer states persists, poverty will become increasingly concentrated in a handful of lower income states. It is worth noting that in 2012, three large lower income states alone (Uttar Pradesh, Bihar and Madhya Pradesh) accounted for 44 percent of India’s poor. And, when we look beyond consumption poverty to other measures of deprivation, India’s picture looks more challenging. We discuss this in a later article in this series.
Nonetheless, the story of India’s transformation remains one of optimism. Although the full potential of economic growth to reduce poverty is yet to be unleashed, the links between growth and poverty reduction have become stronger than in the previous decade. In addition, the manner in which growth has impacted poverty in urban and rural areas, as well as in different sectors, has changed significantly. This forms an integral part of India’s story that future articles in this series will explore.
Reference: Ambar Narayan and Rinku Murgai: “ Looking Back on Two Decades of Poverty and Well-Being in India”, WPS 7626
This blog was originally published in the Indian Express on 18th May, 2016.


Join the Conversation