Blog #3: Poverty down, but 1 in 2 hangs by a thread
India is home to the largest number of poor people in the world, as well as the largest number of people who have recently escaped poverty. Over the next few weeks, this blog series will highlight recent research from the World Bank and its partners on what has driven poverty reduction, what still stands in the way of progress, and the road to a more prosperous India.
We hope this will spark a conversation around #WhatWillItTake to #EndPoverty in India. Read all the blogs in this series, we look forward to your comments.
The sharp decline in poverty in India has been accompanied by a strong pattern of upward mobility, leading to an emerging middle class. Education, urban residence, and wage work have contributed to this higher-than-average upward mobility and lower downward mobility. Yet, a vast share of the population remains vulnerable to slipping back into poverty, suggesting that gains against poverty need to be deepened and made more secure. Scheduled Tribes stand out as a group that has fallen further behind, with one-third stuck in chronic poverty.
India’s strides in reducing poverty over the last two decades have received a lot of attention, including in this series. Between 1994 and 2012, the share of India’s population living in poverty was halved, falling from 45 percent to 22 percent.
Let’s now try to look at patterns that show how individuals transition into and out of poverty. We focus on how households transitioned into and out of poverty between 2005 and 2012 - the years for which the latest set of government data are available.[1]
In 2005, 37 percent of individuals in India were poor. By 2012, this had fallen to only one in five. In other words, roughly 15 percent of the population that was poor in 2005 was no longer poor by 2012. It is, however, plausible that while some individuals escaped poverty, others fell into it.
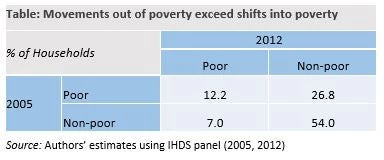
The good news is that upward mobility has been the dominant trend. As one would expect, more people have moved up – out of poverty – than the other way around. As the table shows, nearly one-third of all households changed their poverty status between 2005 and 2012; this includes 27 percent who moved out of poverty and 7 percent who fell into it.
Less reassuringly, we find that many households that escaped poverty after 2005 still had consumption levels that were dangerously close to the poverty line in 2012. In other words, large numbers of those who managed to move out of poverty by 2012 are still vulnerable to slipping back; in fact they face a high risk of doing so.
A simple approach to defining vulnerability is by doubling the poverty line: all individuals who are above the regular poverty line but below this “double” line are defined as vulnerable.[2] By using this approach, we observe that about half of India’s population was vulnerable in 2012, stuck between poverty and the relative stability of the middle class. Indeed, the vulnerable continued to be the largest population group over the period. Their new-found position is precarious.
Vietnam provides an interesting contrast to India’s experience. It is a middle income country that has been one of the strongest performers in poverty reduction. Both countries saw similar shares of the population moving out of poverty, and the vulnerable moving into the middle class. But downward mobility was also much more common in India, reflecting the still high levels of vulnerability to slipping back into poverty.
What makes it more likely for some poor families to move out of poverty while others are unable to do so? Where people live seems to matter, as living in urban areas is more likely to be associated with moving out of poverty. Characteristics such as educational attainment and engagement in salaried work are both positively correlated with higher-than-average chances of upward mobility and lower-than-average chances of moving downwards.
However, a worrisome finding is that Scheduled Tribes are harder to reach—they are less likely to move out of poverty and more likely to stay poor or fall into poverty. These differences between social groups cannot be fully explained by differences in household characteristics. Looking forward, poverty and vulnerability among ethnic minorities will remain a challenge for poverty reduction in India.
This blog was originally published in the Indian Express on 25th May, 2016.
References
Hai-anh Dang and Peter Lanjouw. (2015) “Poverty Dynamics in India between 2004 and 2012: Insights from Longitudinal Analysis using Synthetic Panel Data.” Policy Research Working Paper 7270, World Bank.
Carlos Felipe Balcazar Salazar, Sonal Desai, Rinku Murgai and Ambar Narayan. (2016) “Why did Poverty Decline in India? A Nonparametric Decomposition Exercise.” Policy Research Working Paper 7602, World Bank.
***


Join the Conversation