Blog #5: The low income, low growth trap
India is home to the largest number of poor people in the world, as well as the largest number of people who have recently escaped poverty. Over the next few weeks, this blog series will highlight recent research from the World Bank and its partners on what has driven poverty reduction, what still stands in the way of progress, and the road to a more prosperous India.
We hope this will spark a conversation around #WhatWillItTake to #EndPoverty in India. Read all the blogs in this series, we look forward to your comments.
While India’s economy has grown more rapidly in recent decades, the gains have been unevenly spread, and some regions have fallen further behind the rest of the country. In particular, India’s seven ‘low-income’ states have struggled to shake off the legacy of high consumption poverty, low per capita incomes, poor human development outcomes and the persistence of poverty among tribal populations. The fact that these states are yet to catch-up with the rest of the country illustrates that ‘where you live’ largely determines ‘how well you live'. Addressing this geographic dimension of poverty and well-being will therefore hold the key to improving the lives of millions of Indians.
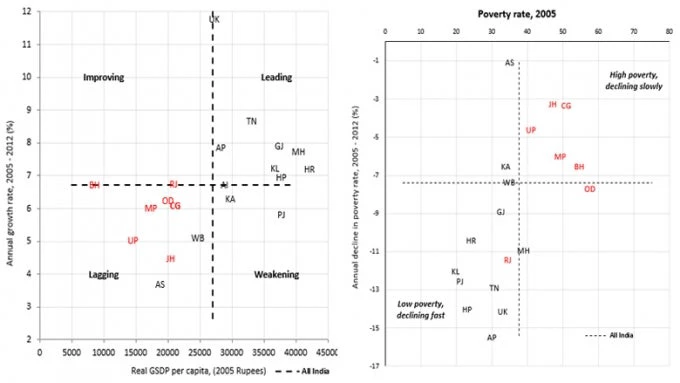
Over the past decade, India witnessed widespread economic growth as well as faster and more widespread poverty reduction[1]. However, some states did not benefit as much as others. The seven ‘low-income states’ (LIS) in particular, comprising of Bihar, Chhattisgarh, Jharkhand, Madhya Pradesh, Odisha, Rajasthan and Uttar Pradesh, continue to lag behind the rest of the country[2]. With the exception of Bihar and Rajasthan, all LIS have grown at a slower pace than other states after 2005. Poverty reduction has also not been as responsive to economic growth as in the other states. In other words, economic growth in the LIS has been less inclusive than in India as a whole.
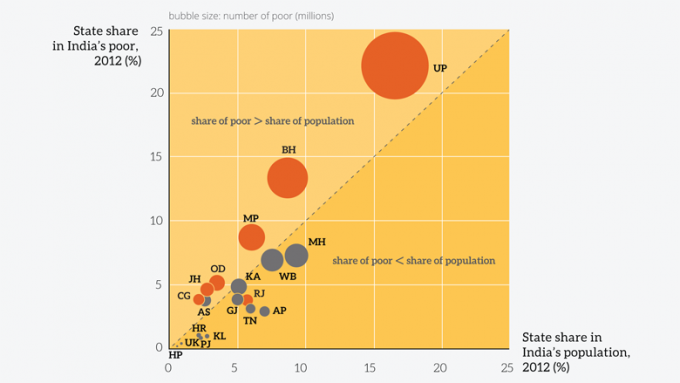
Admittedly, these states did experience greater absolute reductions in poverty after 2005. However, measuring catch-up using absolute changes can be misleading, given that initial levels of poverty and per capita incomes differed vastly across states. In relative terms, both growth and poverty reduction diverged across India’s states after 2005 (figure 1). As a result, today, the LIS as a group - with Rajasthan as the exception - have a poverty rate that is twice that of other states. They are also home to a disproportionate share of India’s poor; in 2012 the LIS accounted for 45 percent of India’s population but nearly 62 percent of its poor. In fact, 44 percent of India’s poor - or over a 100 million people - live in three states alone: Uttar Pradesh, Bihar and Madhya Pradesh (figure 2).

The low-income states (LIS) comprising of Bihar (BH), Chhattisgarh (CG), Jharkhand (JH), Madhya Pradesh (MP), Odisha (OD), Rajasthan (RJ) and Uttar Pradesh (UP) are highlighted in red. The other states (out of the 19 larger states considered here for the analysis) are Andhra Pradesh (AP), Assam (AS), Haryana (HR), Gujarat (GJ), Himachal Pradesh (HP), Karnataka (KA), Kerala (KL), Maharashtra (MH), Punjab (PJ), Tamil Nadu (TN), Uttarakhand (UK) and West Bengal (WB).
Source: World Bank staff calculations based on the National Sample Surveys and Central Statistical Office data.
Beyond monetary measures of well-being, the LIS perform poorly in providing their people with access to basic services and infrastructure. They have the highest rates of open defecation in the country. Close to 60 percent or more of households in these states practice open defecation compared to the national average of 44 percent. Access to drinking water and electricity within the homes of their people continues to be a distant dream for many. More specifically, in Chhattisgarh, Odisha, Jharkhand and Madhya Pradesh only about a third of households have access to drinking water within their homes. As for electricity, only a third of households in Bihar report using electricity, while Uttar Pradesh performs somewhat better with half their households doing so.
While the LIS are by no means alone in facing persistent barriers to human capital development, the challenges that confront them are particularly acute. Residents of these states spend fewer years in school, as evidenced by their low rates of secondary school completion. Moreover, working adults are far less likely to have salaried jobs - the jobs that bring more secure terms of employment. In addition, the rates of infant and maternal mortality in these states are amongst the highest in the country. And, while child malnutrition is high and often endemic even in the more prosperous parts of the country, the malnutrition levels in some LIS are far worse than the national average. Alarmingly, in Jharkhand, Bihar and Uttar Pradesh close to half of all children under the age of 5 are ‘stunted’.
Within the LIS too, poverty and deprivation follow distinct geographic and ethnic patterns. Typically, members of the scheduled castes and scheduled tribes living in the LIS are less well-off than those in other states, both in monetary terms as well as in access to basic services, education and salaried jobs. In fact, clearly distinguishable geographic clusters that have the highest rates of poverty within the LIS are often places with a high concentration of scheduled tribes. This suggests that social exclusion is closely intertwined with geography in India.
Accelerating progress in the LIS will be critical to sustain India’s story of positive growth and poverty reduction. For this, targeted efforts will be needed to release these states from the twin traps of ‘low income-low growth’ and ‘high poverty-slow poverty decline’. The fact that some LIS have been successful on a few important fronts suggests that this can indeed be done. Notably, Rajasthan has managed to separate itself from the low-income group. The state’s growth has not only been higher than the LIS as a whole, its pace of poverty decline has been at par with more prosperous states such as Haryana and Maharashtra. Job creation in some LIS has also been faster than in a few better-off states. For instance, after 2005, Chhattisgarh, Rajasthan, Uttar Pradesh and Odisha created jobs at a faster pace than richer states like Gujarat, Andhra Pradesh and Tamil Nadu. Replicating such successes and spreading prosperity more widely will be key to improving the well-being of the people of these states, as well as of the development of the country at large.
Read India States Briefs. These pull together information from multiple publicly available resources to analyze the performance of India’s low income states.
This blog was originally published in the Indian Express on 7th June, 2016.
***


Join the Conversation