 Photo: Dean Hempshall / 2007
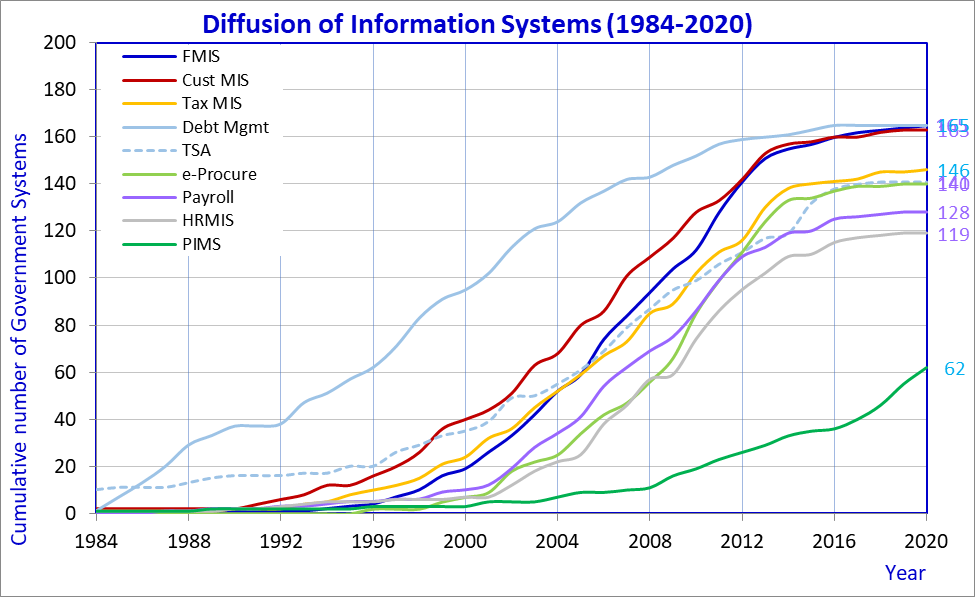
The graph below from the World Bank’s GovTech Maturity Index shows the history of the adoption of systems in the public sector – debt management (165 countries), e-procurement (140 countries), etc. For our colleague Cem Dener, a systems expert, this graph shows a lack of systematic approach to the adoption of systems, following a somewhat haphazard trajectory. And he may be right, but there is another story behind it.

Source: GovTech Maturity Index
Note: The acronyms for each Management Information System (MIS) stand for: Financial Management Information System (FMIS), Customs MIS (Cust MIS), Treasury Single Account (TSA), e-Procurement, Human Resource MIS (HRMIS) and Public Investment Management System (PIMS).
We think that the paces of adoption reflect the priorities and urgencies that evolved over time. Let’s take the debt system, for example. The developing world went through a series of debt crises in the 1980s and 90s (remember the Tequila Crisis?), and as such, it is not surprising that countries decided to develop and implement systems to manage debt – the most pressing issue they were facing – both for internal purposes and for reporting to international creditors. In fact (not shown in the graph), one of the regions where these systems were first adopted was Latin America where debt crises loomed large. And, following this, as cash-strapped countries tried to accumulate their available resources, we see that they moved to implementing treasury single accounts, a unified system of government bank accounts that consolidates and optimizes the use of the government’s cash. But, there are only so many pesos lying around, and the collection of new funds was also required, making the implementation of tax and customs administration systems the next areas to take off.
Now, put yourself in the shoes of a high-level official in a Ministry of Finance in a country with a debt problem – you’re trying to manage your debt, hoard the existing funds, and generate additional resources. There is little money available after that, so the last thing on your mind is how to spend the money (that you don’t actually have). Not surprisingly, then, it was not until the debt and macro issues improved in the 2000s that we see public investment systems and e-procurement systems being rolled out in a growing number of countries.
Taking this into account, in our view, this graph shows the relevant public sector topics at different moments in time. Behind the adoption of each of these systems is a policy priority in terms of reform. In that sense, this graph is very telling.
How would we like to see this graph evolve in the future? More integration of the systems to create efficiencies as information would only need to be collected once but could be shared across parts of government.
Beyond the graph, we’d like to see that systems are oriented towards keeping track of the defining issues of our time such as climate change. We also hope that countries will leverage more the administrative data being produced by these systems. While these systems were created to respond to specific concerns, they are now a repository of millions of data points that can inform governments’ policies and operations, and help them to reinvent and strengthen the way in which they work, as described in the Government Analytics Handbook. While we may not know what future challenges the world will face, what is clear is that governments will continue to adapt their ways of working to respond to emerging needs. We could learn a lot from the history of systems’ adoption as we look ahead.


Join the Conversation
Thank you for sharing the useful information about the https://www.networksbirdnet.com