Last week, I talked about the difficulty of categorizing cash transfer programs neatly into bins of unconditional (UCT) and conditional (CCT) ones. Afterwards,
one of the comments gently chastised me for being overly optimistic of thinking about these programs as being in a continuum of intensity of the conditions rather than in a multi-dimensional design space.
I agreed, but also got to thinking. Should we give up so easily? Isn’t there any value in something that may be a simplification of the true world but is still an improvement over the current state?
Just to remind you what we’re talking about, in the current state of the world, we’re calling similar programs different things: like there are many shades of grey that we’re forced to call either black or white. For example, Honduras’ CCT program, PRAF-II, has enrollment conditions and not much else; Ecuador’s UCT program, BDH, was conceived as a CCT, advertised as such for a while, conducted social marketing campaigns about the value of investing in children’s education, but never monitored school participation or penalized for the lack of it. If we pool many programs like these, categorize them as either CCTs or UCTs, and, say, don’t find any differences in schooling impacts between the two groups, is it because there really is no difference or because our categories are too noisy.
For a Systematic Review we’re conducting for Campbell Collaboration (funded by AUSAid through 3ie) on the relative effectiveness of CCTs and UCTs on schooling outcomes (with Sarah Baird, Francisco Ferreira, Michael Woolcock), we have systematically searched all studies that can be categorized as CCTs or UCTs (the review should hopefully be out soon – Sarah is presenting preliminary findings at Campbell Collaboration’s Colloquium in Chicago later this week). In the study protocol that was published last year, we had proposed to conduct moderator analysis using a set of variables, such as transfer size, identity of the recipient, frequency of transfers, and the degree/extent of monitoring (a moderator is defined as a variable that affects the direction and strength of the relationship between an intervention and the outcome). Accordingly, we had even coded a binary variable (only among the so-called CCT programs) for whether conditions were monitored or not. However, after the exchange on last week’s post, and able to see things a bit more clearly, we put our thinking caps back on: could we categorize all programs, and not just the CCTs, in order of the intensity of schooling conditionalities imposed by the administrators? In other words, could we turn this multi-dimensional design space (of incentives, nudges, social marketing, monitoring, enforcing, etc.) into a linear space and rank cash transfer programs from having nothing to do with schooling at one end to those with explicit conditions that are monitored and enforced at the other?
To do this, two of us came up with categories (from 0-6, described below) and independently scored each of the 35 studiesin our meta-analysis of school enrollment. Afterwards, we got together to compare notes, debated the disagreements, and came to a consensus on the ranking of each program. [ Please see the endnote at the bottom of this post on the independence of the coding of this ‘moderator’ from the effect size for each program]. Our categories, in increasing intensity of conditions, were as follows (# of studies in parentheses):
Using our binary program categorization, forcing the difficult and fuzzy programs to be defined as a CCT or a UCT as best as we can, we find that both types of programs improve the odds of children being in school: 23% for the UCT programs and 41% for CCT programs. The difference between the two has a p-value of 0.183, meaning that the difference, which is sizeable, is statistically insignificant (please note that effect sizes are in odds ratios (OR), meaning that if 75% of the children are in school in the control group and the treatment improved that by 5 percentage points, the effect size is equal to 80/20 divided by 75/25, or 4/3=1.33.)
However, using the categorization above, the picture is much clearer. In a random-effects meta-regression model with effect size as the dependent variable and this moderator describing the ‘intensity of conditionalities’ as the only independent variable, the coefficient estimate is large and statistically significant at the 1% level. The linearization (see Figure 1 below) suggests that each unit increase in the intensity of the conditionality is associated with an increase of 7% in the odds of being enrolled in school:

Another way to see this visually (which also allows you to see each study’s effect size and how they’re broadly categorized) is as follows: group programs into ‘no schooling conditions’ (categories 0-2); ‘some conditions with no monitoring or enforcement’ (categories 3-4); and ‘explicit conditions, monitored and enforced’ (categories 5-6). Here is the forest plot of effect sizes for these groups:
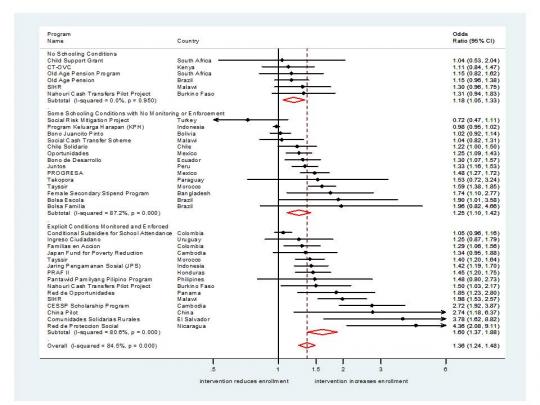
The effect sizes for these three groups are, respectively, 1.18, 1,25, and 1,60. So, while all programs cause a statistically significant improvement in enrollment, the effect in the final group is both meaningfully and significantly larger than the first two groups.
Could it be that this variable is picking up some unobserved characteristics shared by all the ‘would-be successful’ studies, meaning that our finding is simply a correlation and has no causal implications? This is certainly possible, but we could not find the smoking gun that would make this result disappear among the other moderators that we had coded: when we run the same regression, but this time including mean enrollment rate in the control group, transfer size as a share of household income (or annual cost of program per person), whether the transfer is given to the mother/female in the households, the frequency of transfers, whether the intervention is a pilot or a scaled-up national program, etc., the size and significance of the coefficient estimate for the ‘intensity of conditionalities’ remains as large and significant as before. Furthermore, none of these other moderators is associated with the effect size on enrollment.
The preliminary findings of this systematic review are consistent with previous evidence from experiments in Malawi and Burkina Faso, which were themselves more or less consistent with previous evidence using quasi-experimental data: while all cash transfer programs cause some improvement in school enrollment, conditions seem to cause further increases in program impacts.
I’ll provide a heads up in this space (or in our popular Friday links) when the systematic review is published. We will also aim to make the data we compiled, as well as our code, publicly available as soon as possible thereafter, so that other researchers can replicate and improve on our work. In the meantime, as always, comments are welcome.
[ Endnote: When we started coding this new moderator variable last week, we were in the process of revising our meta-analysis in light of comments and suggestions from Campbell Collaboration’s Methods Editors. This involved recalculating effect sizes by synthesizing impact estimates from multiple papers into a single effect size for each intervention – e.g. Mexico’s PROGRESA has 15 papers, many of which had themselves reported multiple effect sizes.As such, the coding this moderator variable should not be influenced by our knowledge of effect sizes. Still, it would have been obviously better if we didn’t think of redefining this variable last week after my blog, but when we were writing our protocol last year. However, without actually starting to conduct this meta-analysis and reading the descriptions of all these programs, we would not have come up with this idea in the first place: classic catch-22. In any case, the data that we compiled for this systematic review, including our coding, will be publicly available as soon as the review is published, so anyone can redo the analysis for himself or herself using alternative categorizations – should they be dissatisfied with our coding.]
Just to remind you what we’re talking about, in the current state of the world, we’re calling similar programs different things: like there are many shades of grey that we’re forced to call either black or white. For example, Honduras’ CCT program, PRAF-II, has enrollment conditions and not much else; Ecuador’s UCT program, BDH, was conceived as a CCT, advertised as such for a while, conducted social marketing campaigns about the value of investing in children’s education, but never monitored school participation or penalized for the lack of it. If we pool many programs like these, categorize them as either CCTs or UCTs, and, say, don’t find any differences in schooling impacts between the two groups, is it because there really is no difference or because our categories are too noisy.
For a Systematic Review we’re conducting for Campbell Collaboration (funded by AUSAid through 3ie) on the relative effectiveness of CCTs and UCTs on schooling outcomes (with Sarah Baird, Francisco Ferreira, Michael Woolcock), we have systematically searched all studies that can be categorized as CCTs or UCTs (the review should hopefully be out soon – Sarah is presenting preliminary findings at Campbell Collaboration’s Colloquium in Chicago later this week). In the study protocol that was published last year, we had proposed to conduct moderator analysis using a set of variables, such as transfer size, identity of the recipient, frequency of transfers, and the degree/extent of monitoring (a moderator is defined as a variable that affects the direction and strength of the relationship between an intervention and the outcome). Accordingly, we had even coded a binary variable (only among the so-called CCT programs) for whether conditions were monitored or not. However, after the exchange on last week’s post, and able to see things a bit more clearly, we put our thinking caps back on: could we categorize all programs, and not just the CCTs, in order of the intensity of schooling conditionalities imposed by the administrators? In other words, could we turn this multi-dimensional design space (of incentives, nudges, social marketing, monitoring, enforcing, etc.) into a linear space and rank cash transfer programs from having nothing to do with schooling at one end to those with explicit conditions that are monitored and enforced at the other?
To do this, two of us came up with categories (from 0-6, described below) and independently scored each of the 35 studiesin our meta-analysis of school enrollment. Afterwards, we got together to compare notes, debated the disagreements, and came to a consensus on the ranking of each program. [ Please see the endnote at the bottom of this post on the independence of the coding of this ‘moderator’ from the effect size for each program]. Our categories, in increasing intensity of conditions, were as follows (# of studies in parentheses):
- UCT programs unrelated to children or education – such as Old Age Pension Programs (2)
- UCT programs targeted at children with an aim of improving schooling outcomes – such as Kenya’s CT-OVC or South Africa’s Child Support Grant (2)
- UCTs that are conducted within a rubric of education – such as Malawi’s SIHR UCT arm or Burkina Faso’s Nahouri Cash Transfers Pilot Project UCT arm (3)
- Explicit conditions on paper and/or encouragement of children’s schooling, but no monitoring or enforcement – such as Ecuador’s BDH or Malawi’s SCTS (8)
- Explicit conditions, (imperfectly) monitored, with minimal enforcement – such as Brazil’s Bolsa Familia or Mexico’s PROGRESA (8)
- Explicit conditions with monitoring and enforcement of enrollment condition – such as Honduras’ PRAF-II or Cambodia’s CESSP Scholarship Program (6)
- Explicit conditions with monitoring and enforcement of attendance condition – such as Malawi’s SIHR CCT arm or China’s Pilot CCT program (10)
Using our binary program categorization, forcing the difficult and fuzzy programs to be defined as a CCT or a UCT as best as we can, we find that both types of programs improve the odds of children being in school: 23% for the UCT programs and 41% for CCT programs. The difference between the two has a p-value of 0.183, meaning that the difference, which is sizeable, is statistically insignificant (please note that effect sizes are in odds ratios (OR), meaning that if 75% of the children are in school in the control group and the treatment improved that by 5 percentage points, the effect size is equal to 80/20 divided by 75/25, or 4/3=1.33.)
However, using the categorization above, the picture is much clearer. In a random-effects meta-regression model with effect size as the dependent variable and this moderator describing the ‘intensity of conditionalities’ as the only independent variable, the coefficient estimate is large and statistically significant at the 1% level. The linearization (see Figure 1 below) suggests that each unit increase in the intensity of the conditionality is associated with an increase of 7% in the odds of being enrolled in school:
Another way to see this visually (which also allows you to see each study’s effect size and how they’re broadly categorized) is as follows: group programs into ‘no schooling conditions’ (categories 0-2); ‘some conditions with no monitoring or enforcement’ (categories 3-4); and ‘explicit conditions, monitored and enforced’ (categories 5-6). Here is the forest plot of effect sizes for these groups:
The effect sizes for these three groups are, respectively, 1.18, 1,25, and 1,60. So, while all programs cause a statistically significant improvement in enrollment, the effect in the final group is both meaningfully and significantly larger than the first two groups.
Could it be that this variable is picking up some unobserved characteristics shared by all the ‘would-be successful’ studies, meaning that our finding is simply a correlation and has no causal implications? This is certainly possible, but we could not find the smoking gun that would make this result disappear among the other moderators that we had coded: when we run the same regression, but this time including mean enrollment rate in the control group, transfer size as a share of household income (or annual cost of program per person), whether the transfer is given to the mother/female in the households, the frequency of transfers, whether the intervention is a pilot or a scaled-up national program, etc., the size and significance of the coefficient estimate for the ‘intensity of conditionalities’ remains as large and significant as before. Furthermore, none of these other moderators is associated with the effect size on enrollment.
The preliminary findings of this systematic review are consistent with previous evidence from experiments in Malawi and Burkina Faso, which were themselves more or less consistent with previous evidence using quasi-experimental data: while all cash transfer programs cause some improvement in school enrollment, conditions seem to cause further increases in program impacts.
I’ll provide a heads up in this space (or in our popular Friday links) when the systematic review is published. We will also aim to make the data we compiled, as well as our code, publicly available as soon as possible thereafter, so that other researchers can replicate and improve on our work. In the meantime, as always, comments are welcome.
[ Endnote: When we started coding this new moderator variable last week, we were in the process of revising our meta-analysis in light of comments and suggestions from Campbell Collaboration’s Methods Editors. This involved recalculating effect sizes by synthesizing impact estimates from multiple papers into a single effect size for each intervention – e.g. Mexico’s PROGRESA has 15 papers, many of which had themselves reported multiple effect sizes.As such, the coding this moderator variable should not be influenced by our knowledge of effect sizes. Still, it would have been obviously better if we didn’t think of redefining this variable last week after my blog, but when we were writing our protocol last year. However, without actually starting to conduct this meta-analysis and reading the descriptions of all these programs, we would not have come up with this idea in the first place: classic catch-22. In any case, the data that we compiled for this systematic review, including our coding, will be publicly available as soon as the review is published, so anyone can redo the analysis for himself or herself using alternative categorizations – should they be dissatisfied with our coding.]

Join the Conversation