In March 2020, in-person field research around the world came to a quick halt in response to the burgeoning global threat of Covid-19. This was a necessary step to prioritize the safety of staff, researchers, partners, and members of the communities where research is conducted—but it also forced dramatic changes to that research. Institutions and researchers with ongoing studies adapted to remote research methods where possible and were forced to pause or even cancel studies altogether if not. A host of new studies sprung up in response to the changing realities of field work and research priorities.
Existing examinations of the impact of the pandemic on economics research have focused on research output, i.e., the completion of research that in most cases was started well before the onset of the pandemic. Indeed, both general interest and development economics journals report a surge in submissions in 2020, perhaps caused by researchers using the disruption to new research to spend time finishing and submitting pre-existing research. Not all researchers were affected alike, however, as some researchers saw their available research time diminished with the pandemic. For example, an examination of several working paper series (NBER, CEPR, and VoxEU) showed that gender disparities in research output during the pandemic have been especially severe among junior and mid-career researchers. Yet we know much less about how the pandemic has affected the research pipeline and initiation of new research and thus longer term research productivity. To begin to understand this, we would need researchers to register their research ideas in advance and examine changes in those registrations over time -- something we can do for randomized controlled trials (RCTs) by using data from the American Economic Association (AEA) RCT Registry.
Analyzing data from the AEA RCT Registry
In order to identify trends in the research pipeline, we examined public data from the AEA RCT Registry and the Harvard Dataverse. The AEA RCT Registry was launched in 2013 to provide a tool for researchers to improve the credibility of their research and for the social sciences as a whole to combat the file-drawer problem. By allowing researchers to declare their study design and outcomes, trial (pre-)registration can provide transparency on researchers' plans and intended analysis methods. Using information from the AEA RCT Registry on dates of research initiation, implementation, and registration we ascertained how the social science RCT research pipeline changed following the pandemic and whether the changes were due to researchers wrapping up existing research or new projects being initiated.
Figure 1: Entries by study region and year, 2013-2020
The AEA RCT Registry currently has over 4,500 registered RCTs in 159 countries, with most projects taking place in Africa (Figure 1). The number of yearly registrations has been growing steadily since its inception, and 2020 was no different: there were 1,056 registrations in 2020, compared to 926 in 2019 and 710 in 2018. Likewise, the general trend towards increasing proportions of pre-registered projects, defined as those for which the registration date is earlier than the projected intervention start date, continued at a stable rate in 2020 (Figure 2A). (Note that the 2016 dip in proportion of pre-registered trials may be a result of J-PAL staff making a big push from January 2016 to January 2017 to register the backlog of completed studies.) Furthermore, and as can be seen in Figure 2B, the gains in new projects in 2020 were largely driven by the second half of the year. All this suggests that registrations in 2020 were not caused by a push to register pre-existing research, providing a credible window into the social science RCT pipeline.
Figure 2a: Proportion of pre-registered trials, 2013-2020
Figure 2b: Proportion of pre-registered trials, 2019-2020
For each past, present, or future study registered, the registry contains both broad information about its scope and purpose, including information on the study’s geographic and subject areas, as well as specific details about its experimental design, sample size, and intervention. To ensure we capture statistics on the research pipeline specifically, we restrict our sample for the graphs that show registrations in 2019 and 2020 to only include 1) trials pre-registered in that time period and 2) projects that were both registered and begun between January 1, 2019 and March 1, 2020 OR between March 1 and December 31, 2020, regardless of whether the registration or intervention happened first. We used this data to examine changes in the pipeline of social science RCT research along three main dimensions: i) composition of research teams; ii) research topics; and iii) geographic scope.
1. How has the distribution of researchers conducting social science RCTs changed during the Covid-19 pandemic?
To examine this question, we looked at two variables: the estimated gender of researchers and the proportion of new researchers registering RCTs.
Figure 3 shows the proportion of “new” researchers in registry entries in 2019-2020 pre- and post-Covid, where post-Covid refers to entries registered after March 1, 2020. A researcher is designated as “new” if they have not been listed as a Principal Investigator (PI) on any of the previous entries in the registry. The proportion of new PIs (black line) declines during the first few months of the pandemic but seems to be increasing in the last few months of 2020. The figure also shows that while new PIs are predominantly based in North America, the proportion of new PIs from North America decreased after the pandemic in favor of an increase in the proportion of new PIs from Europe. (A caveat: the graphs that use data on researcher university location are restricted to the approximately 40% of PIs that we were able to merge to a university; while there is almost certainly some selection into this sample, it is also likely that the selection does not differ pre- and post-pandemic.)
Figure 3: Proportion of new researchers across PIs and by university region
When we look at gender, we see that the overall proportion of female PIs starting new projects during the pandemic seems to decrease, consistent with the trends documented in working paper output (Figure 4). Disaggregating, we can see that while the share of female PIs among new researchers declines sharply at the beginning of the pandemic it begins to recover towards the end of 2020, nearly reaching its 2019 peak. However, despite these suggestive trends, the large and outlier-driven dip in the proportion of female PIs in the second quarter of 2019 leaves the average proportion of female PIs pre- and post-pandemic largely the same (37 and 40% for all researchers and new researchers, respectively), preventing any stronger conclusion about gender inclusiveness in the RCT pipeline during Covid.
Figure 4: Proportion of female PIs
2. How have RCT research topics changed during the pandemic?
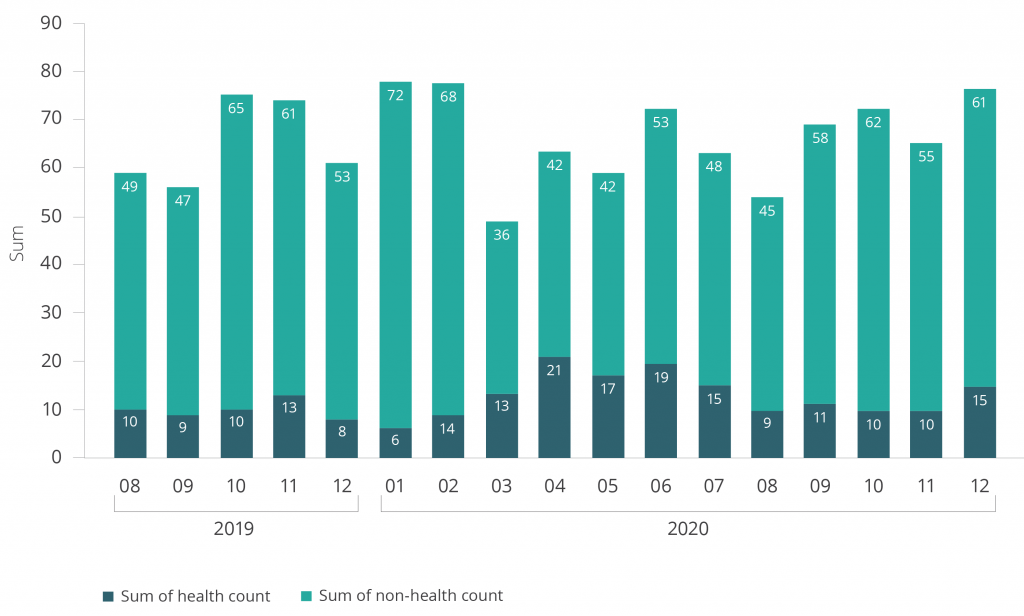
In order to answer this question, we homed in on the “keywords” field of the registry (a mandatory field) and specifically looked at the number of new studies registering with “Health” as a keyword. The keywords field has 16 broad choices, ranging from “Education” to “Behavior” to “Post-conflict.” Figure 5 below presents the results.
Starting in March 2020 and lasting until July 2020, there was a spike in the number of studies marked as relating to “Health.” The average number of monthly registrations of health studies for March-December 2020 was 17.7—up 43% percent from the same period in 2019.
Figure 5: Total projects disaggregated by “health” keyword

To delve a little deeper into these findings, we next looked at mentions of “Covid-19” or “Coronavirus” in the registry’s title, abstract, and experimental design fields in 2020, with this restriction aiming to avoid “false positives,” or projects that only mentioned Covid-19 in the registration but did not have it as the primary research topic. Consistent with the trends seen in health registrations, there is a large number of Covid-19 mentions in the March-July period, with sustained but lower interest in the later months of 2020 (see Figure 6).
Figure 6: Entries referencing Covid-19, 2020
While the two trends largely move in the same direction, the drop-off in health registrations after July 2020 is steeper than that for Covid-19 references: the proportion of health studies registered August–December of 2019 (15.4%) was similar to that for August–December 2020 (16.4%). This suggests that projects focused on Covid-19 may be crowding out other health-related projects.
3. How did the pandemic affect the geographic distribution of social science RCT research?
As shown in Figure 7, the geographic distribution of registered RCTs has remained relatively constant since the registry’s inception, with the two notable trends being the increased proportion of registered studies conducted in Europe and the decreased proportion in sub-Saharan Africa.
Figure 7: Proportion of entries by study region and year, 2013-2020
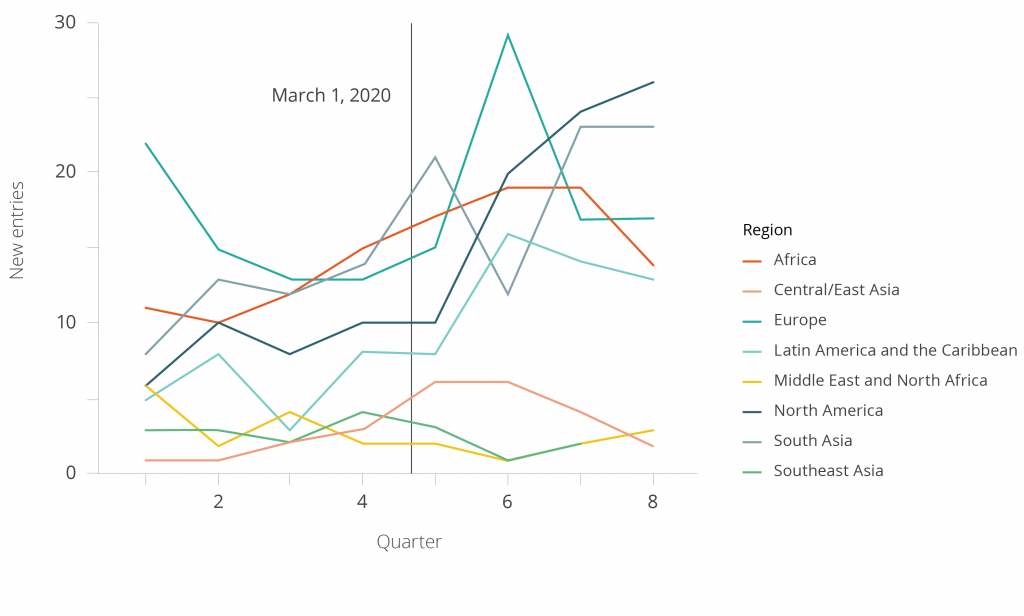
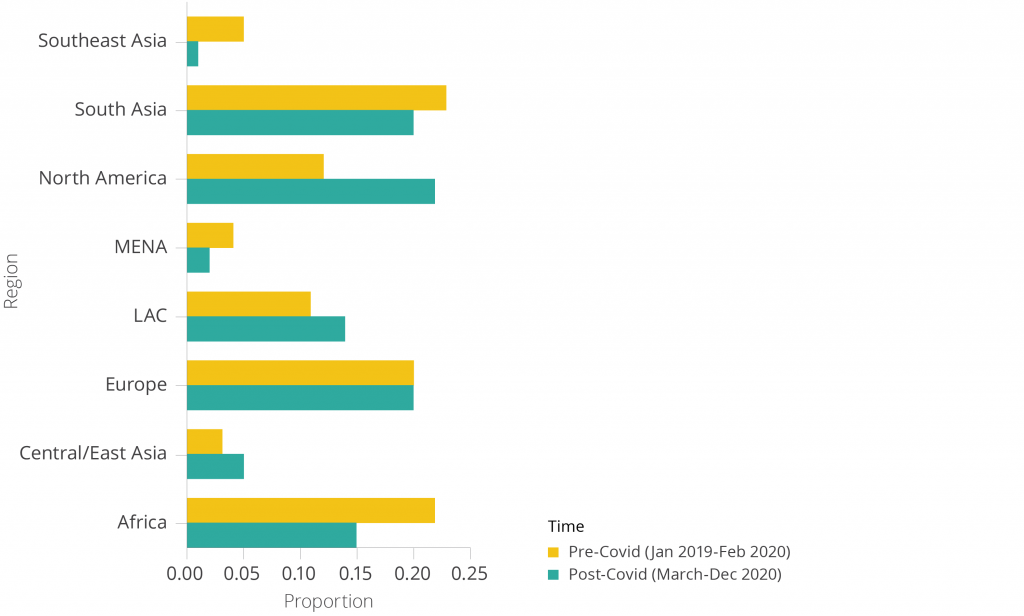
As can be seen in Figures 8 and 9, restricting the timeline to 2019–2020 provides two striking results: i) the proportion and number of registered studies conducted in Europe, North America, and Latin America and the Carribean (LAC) spike between the second and third quarters of 2020, roughly the same time period with above-average levels of health studies documented above; and ii) the number of registered studies conducted in sub-Saharan Africa, East/Central Asia, and Southeast Asia begin to drop over that same period and then remain low. (A caveat: Figures 8 and 9 are restricted to projects we could match to a country, about 75 percent of all registrations.)
Figure 8: Entries by study region and quarter, 2019-2020

Figure 9: Proportion of projects registered by study region, 2019-2020

We hypothesize that these trends are caused by some combination of ease of access (e.g., better online survey infrastructure) and increased home-country saliency (i.e., the draw of conducting research on a problem in your own geographic region) for researchers based in North America, Europe, and Latin America. While just a start, we do have some suggestive evidence for these points. First, while constrained by a small sample size (we were only able to match both a project region and a PI’s institution region in ~15% of PI-project pairs), we do find that the proportion of projects that were conducted in the same region as their PI’s institution increased: 66% of PI-project pairs in the sample had the same region in our post-Covid period, compared to 46% in our pre-Covid period.
We proxy for online or other “lighter-touch” interventions by taking the proportion of projects that mention any of a number of words in their titles, abstracts, or intervention descriptions that we deemed most likely to be associated with light-touch interventions (e.g., “messaging”, “email,” “nudge”). We see a jump in this proportion in the third quarter of 2020, suggesting that some RCT research during the pandemic pivoted to light-touch interventions, like information and nudges, that could be more easily administered remotely (Figure 10).
Figure 10: Proportion of information interventions
Key takeaways from our analysis
The pandemic has changed the pipeline of RCT research in the social sciences, with shifts in PI composition as well as the topical and geographic focus of their research.
Following March 2020, the proportion of female researchers registering new trials dropped, as did the share of PIs registering an entry for the first time.
At the same time, there was an initial swing towards research on health topics—but one that quickly reversed. Lighter-touch, information interventions, and interventions that dealt with Covid saw a similar increase, but one that seems more sustained, suggesting some crowd-out among health-related RCTs.
Finally, researchers shifted towards starting more projects in North America, LAC, and (initially) Europe, with some suggestive evidence of that increase being driven by researchers based in those areas studying online/light-touch interventions.
Many questions remain, including i) are these shifts interrelated, and what mechanisms are behind them? ii) is there a concurrent shift in other research markers and outputs? iii) how long will these shifts last? These are topics we will continue to explore using the AEA RCT Registry metadata.
The AEA RCT Registry metadata can be accessed by following the instructions here. To learn more about J-PAL’s research transparency efforts, read about our core activities.
The authors Jack Cavanagh, Maya Duru, Sabhya Gupta, Sarah Kopper, and Keesler Welch
are Members of the Research, Education, and Training team at J-PAL Global. They thank Elizabeth Bond and Amanda Girard for assistance designing the graphics.


Join the Conversation