It’s hard to argue against the idea that giving cash to someone in need is the best you can do for that person in most circumstances: money maximizes your choice set and any conditions, strings attached, etc. makes that set smaller. With the advance of mobile technologies and better, bigger data, you can now send someone anywhere in the world money and make that person’s life instantly better – at least in the short run. But, what if I told you that with every dollar you send to one poor person, you’re taking away food from a few other people? How should we evaluate the impact of your transfer then?
Before we get back to that question, let’s look at the newest piece of evidence on cash transfer externalities first, which comes from the recent McIntosh and Zeitlin study benchmarking a USAID nutrition and health package called Gikuriro against cash transfers by GiveDirectly in Rwanda – evidence you would not have read about in the NYT, NPR, or Vox (but, you would have seen if you read the authors’ own blog post on Development Impact). That so-called negative externalities might exist in cash transfer programs has been pointed out by multiple papers (whether it’s direct spillovers, price or general equilibrium effects: please see further below for links) and has been the subject of vigorous debate in this space earlier this year. Since there has been some disbelief about the veracity of these negative externalities, let’s take a look at the latest evidence on this.
The authors designed the study so that we could see not only the effects on the targeted beneficiaries of each program, which constituted about one in five residents, on average, of each study village, i.e. the intention-to-treat effect ITT), but also for the villages as a whole, the so-called total causal effect (TCE) (latest ungated version is here). This requires sampling not only households eligible for the intervention(s), but also a random sample of those who are ineligible. Comparing the latter to the pure control group gives us spillover effects on the non-treated (SNT), and a weighted average of the ITT and the SNT is equal to the TCE. RCTs that fail to account for spillovers can produce biased estimates of intention-to-treat effects, while finding meaningful treatment effects but failing to observe deleterious spillovers can lead to misconstrued policy conclusions. Therefore, reporting the TCE is as important as the ITT, if not more important in many cases: if the program caused a bunch of people to escape poverty while others to fall into it, leaving the overall poverty rate unchanged (TCE=0), you’d have to argue much harder to convince your audience that your program is a success because the ITT is large and positive.
Let’s start with the evidence that was reported in most outlets on the ITT effects, which are presented in Table 5: the small GiveDirectly transfers that were cost-equivalent to the Gikuriro program did not do much, but the large cash transfers (giving about four times as much to eligible households) increased per capita household (HH) consumption and total HH wealth by 32 and 34 percent, respectively (p-values 0.1, respectively), while increasing dietary diversity by more than 10% (p-value
Now, direct your attention to Table 8. The total causal effects on each of these three outcomes is negative, statistically non-significant, but economically meaningful – especially considering that there are many more ineligible residents in the study villages than beneficiaries (about four to one). Before we discuss the implications of these estimates for the size of the spillover effects on the non-treated, let’s see what the authors said in their very carefully written paper and their above-mentioned blog post:
“The ‘large’ transfers, so positive among beneficiaries, in general see negative signs across the consumption indicators, ... These results are consistent with GD ‘large’ transfers having some negative spillover effects on non-beneficiaries, such as might be generated by an increase in local consumer prices (consistent with Cunha et al. (forthcoming)) or a decrease in interest rates as transfers are consumed and saved. On net there is little evidence that the widespread benefits observed in the eligibles carry over to the broader population of the village when the transfers are targeted at a relatively small fraction of the households.” (p.29 in Zeitlin and McIntosh, 2018)
“Recent studies have highlighted the potential for external effects of cash-transfer programs. In our own work the point estimates on village-level impacts are consistent with negative spillovers of the large transfer on some outcomes (they are also consistent with Gikuriro’s village-level health and nutrition trainings having improved health knowledge in the overall population). Cash may look less good as one thinks of welfare impacts on a more broadly defined population. Donors weighing cash-vs-kind decisions will need to decide how much weight to put on non-targeted populations, and to consider the accumulated evidence on external consequences.” (Authors’ blog post)
The calculation of the effect sizes on the ineligible population is not difficult. Remember that the TCE in Table 8 is a weighted average of the ITT in Table 5 and the SNT that we’re after. So, if we know the weights, we can calculate the SNT and thankfully the authors have reported the sampling weights in their paper. When we use those, here is what we get: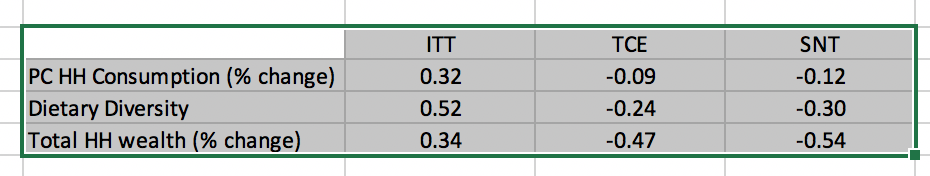
What might this all mean?
There is now a legitimate body of evidence that suggests that we should be paying more attention to these effects. From a study design perspective, it likely makes more sense to power studies to detect meaningful SNT and TCE effects, which means more expensive studies. More substantive questions for the policymaker remain, however.
First, let’s take the possible negative consumption effects seriously for a second. After all, we have a pretty good idea now that cash transfers may not only have negative effects on consumption, but on psychological wellbeing via direct spillover effects on non-treated eligible populations ( Baird et al. 2013; Haushofer and Shapiro 2018), or on assets and revenues of households and child stunting through local price effects on everyone in program areas ( Cunha et al. 2018; Filmer et al. 2018; Haushofer and Shapiro 2018). McIntosh and Zeitlin themselves suspect price effects to be playing a role in the suggestive evidence they provide. What do they imply?
Well, the welfare implications depend on how the policymaker values the gains among the beneficiary population vs. the losses (and possible gains) in the ineligible population: sampling weights simply bring us back to the “one person one vote” interpretation of the village economy. But, we might care much less about the 10% loss of income for the rich moneylender than the same change for the median villager than for an ultra-poor HH. In other words, we might be able to live with a progressive redistribution.
But, the evidence we have from developing countries does not save us here. In Filmer et al., stunting rates are increasing. In McIntosh and Zeitlin, baseline means in per capita HH consumption seem equal (and low) between the eligible and ineligible populations. In the other studies mentioned above, the spillovers are on randomized-out eligible individuals or HHs. So, the idea of putting substantially smaller weight to the effects on the ineligible population is not viable. Furthermore, as most, but not all, programs treat a small percentage of the population, the cumulative spillovers on the majority of citizens is troubling. Remember that the large GiveDirectly transfers in the Rwanda study are given to one in five people, so the average effects are different than cumulative ones…
Second, there is the issue of how much money to give to how many people? Variation in the intensity of treatment can determine whether there are important scale or congestion effects that lead to differential impacts on prices, norms, or behavior. The authors touch on this point in the Rwanda study and state “The strong consumption benefits that have quite consistently been found in large cash transfer programs may well tip the scales in favor of concentrated programs, even for inequality-averse planners.” But, that recommendation seems to ignore the negative spillover effects that may vary by intensity. If they are more intense for large amounts given to smaller numbers of people, ITT may go up while SNT goes down, leaving TCE unaffected.
One solution around this problem may be to resort to geographic targeting of poor areas, but then implement generous categorical (such as elderly, children, and disabled/unemployed) or universal treatment of everyone within those areas. This is not a novel recommendation, in fact it is an age-old problem in the poverty reduction literature. It has the obvious limitation of leaving poor people in non-poor areas unsupported by programs, raising horizontal inequity issues, but it may be possible to have individually-targeted safety net programs in such areas, if the numbers of needy are rather small (and hence, the spillover or GE effects less likely).
Third, from an evaluation standpoint, we should not only be measuring the TCE, but we should also be focusing on outcomes that we care about for everyone. While it is hard to think about the weights we should be attaching to a 10% increase in consumption for someone in the bottom decile vs. a 10% loss for a HH in the fifth decile, it is easier to agree that being poor, stunted, or depressed are bad regardless of who you are and what part of the distribution you were at baseline. Programs we implement should reduce the poverty rate, stunting, and depression while increasing subjective wellbeing.
Closing thoughts…
While the USAID and the authors of the Rwanda study should be applauded for the enormous effort that it took to produce this serious benchmarking study, we should remember that the intervention that received the most discussion in the media has been the large cash transfer arm. Interestingly, this was not benchmarked, but rather the amount was suggested by GiveDirectly, presumably based on their previous studies for maximizing benefits while minimizing fixed overhead costs. You might say that it would be silly to try to create a nutrition program that cost $560 just for the sake of this study and you would be right.
But, Gikuriro was modeled after a similar food-assisted maternal and child health and nutrition program, called Tubaramure in Burundi. My understanding is that Tubaramure cost about $800 per household and the main difference with Gikuriro seems to be the provision of micronutrient-fortified food rations in the former. Leroy, Olney, and Ruel (2016) show that Tubaramure had significant effects on hemoglobin and anemia among children, and maternal anemia among a sub-group (those who gave birth within the past three months). In fact, it is likely that the reason maternal and child anemia are primary outcomes in the Rwanda study is because Gikuriro was modeled after Tubaramure and the implementers hoped to see effects in those outcomes. I don’t know why the food rations were not a part of the package in Rwanda…
The bottom line, however, is that had a more expensive cost-equivalent Gikuriro found similar effects on maternal and child anemia, even the narrative on large cash transfers would have to be qualified: note that receiving $560 had no effect on anemia for pregnant women, recent mothers, or children under five, who were the eligible target population for all arms. We would have to be making similarly qualified statements as we have to make for the smaller transfers vs. cheaper Gikuriro.
Finally, not all studies of transfer programs find negative spillover effects. For example, the evaluation of BRAC’s TUP (graduation) program in Bangladesh by Bandiera et al (2017), find no spillover effects for consumption and assets; negative spillovers for land but in a progressive redistribution of land from the richest to the poorest; and positive spillover effects for business assets among the near-poor and middle classes through increased financial intermediation. It should be noted that the TUP is far from a GiveDirectly-style unconditional cash transfer in that it makes in kind transfers and spends about 50% of its funds on complementary activities (training, coaching, etc.).
Admittedly, this is all a lot to take. If we want studies like this to drive policy more comprehensively, we should strive to design them to measure outcomes consistent with the ultimate goals of the policymakers, which should also be spelled out explicitly. That might mean better benchmarking, more statistical power for estimands other than the ITT, and longer-term outcomes that would allow us to judge overall welfare. As for private citizens, please try to keep all of this in mind when you’re making your charitable donations: nobody said doing the most good you can do was easy…

Join the Conversation