- If you could go back to the time you did not have any children and could choose exactly the number of children to have in your whole life, how many would that be?
- How many of these children would you like to be boys, how many would you like to be girls, and for how many would it not matter if it’s a boy or a girl?
Researchers classify a respondent as having son preference if she wants more boys than girls, or calculate her desired ratio of boys to total children as a continuous variable. Such measures have been used to study how son preference differs between husbands and wives, how it varies across societies, and more.
An underappreciated problem with this approach is what I will call “odd-number bias.” To illustrate the problem, I employ data from India’s 2005-6 DHS (National Family Health Survey, round 3); however, the issue is not specific to India (or women’s responses or the binary measure, which I use here).
The figure below shows a zigzag pattern between wanting more boys than girls and the respondent’s desired number of children. When a person wants an odd number of children, her son preference appears to be higher.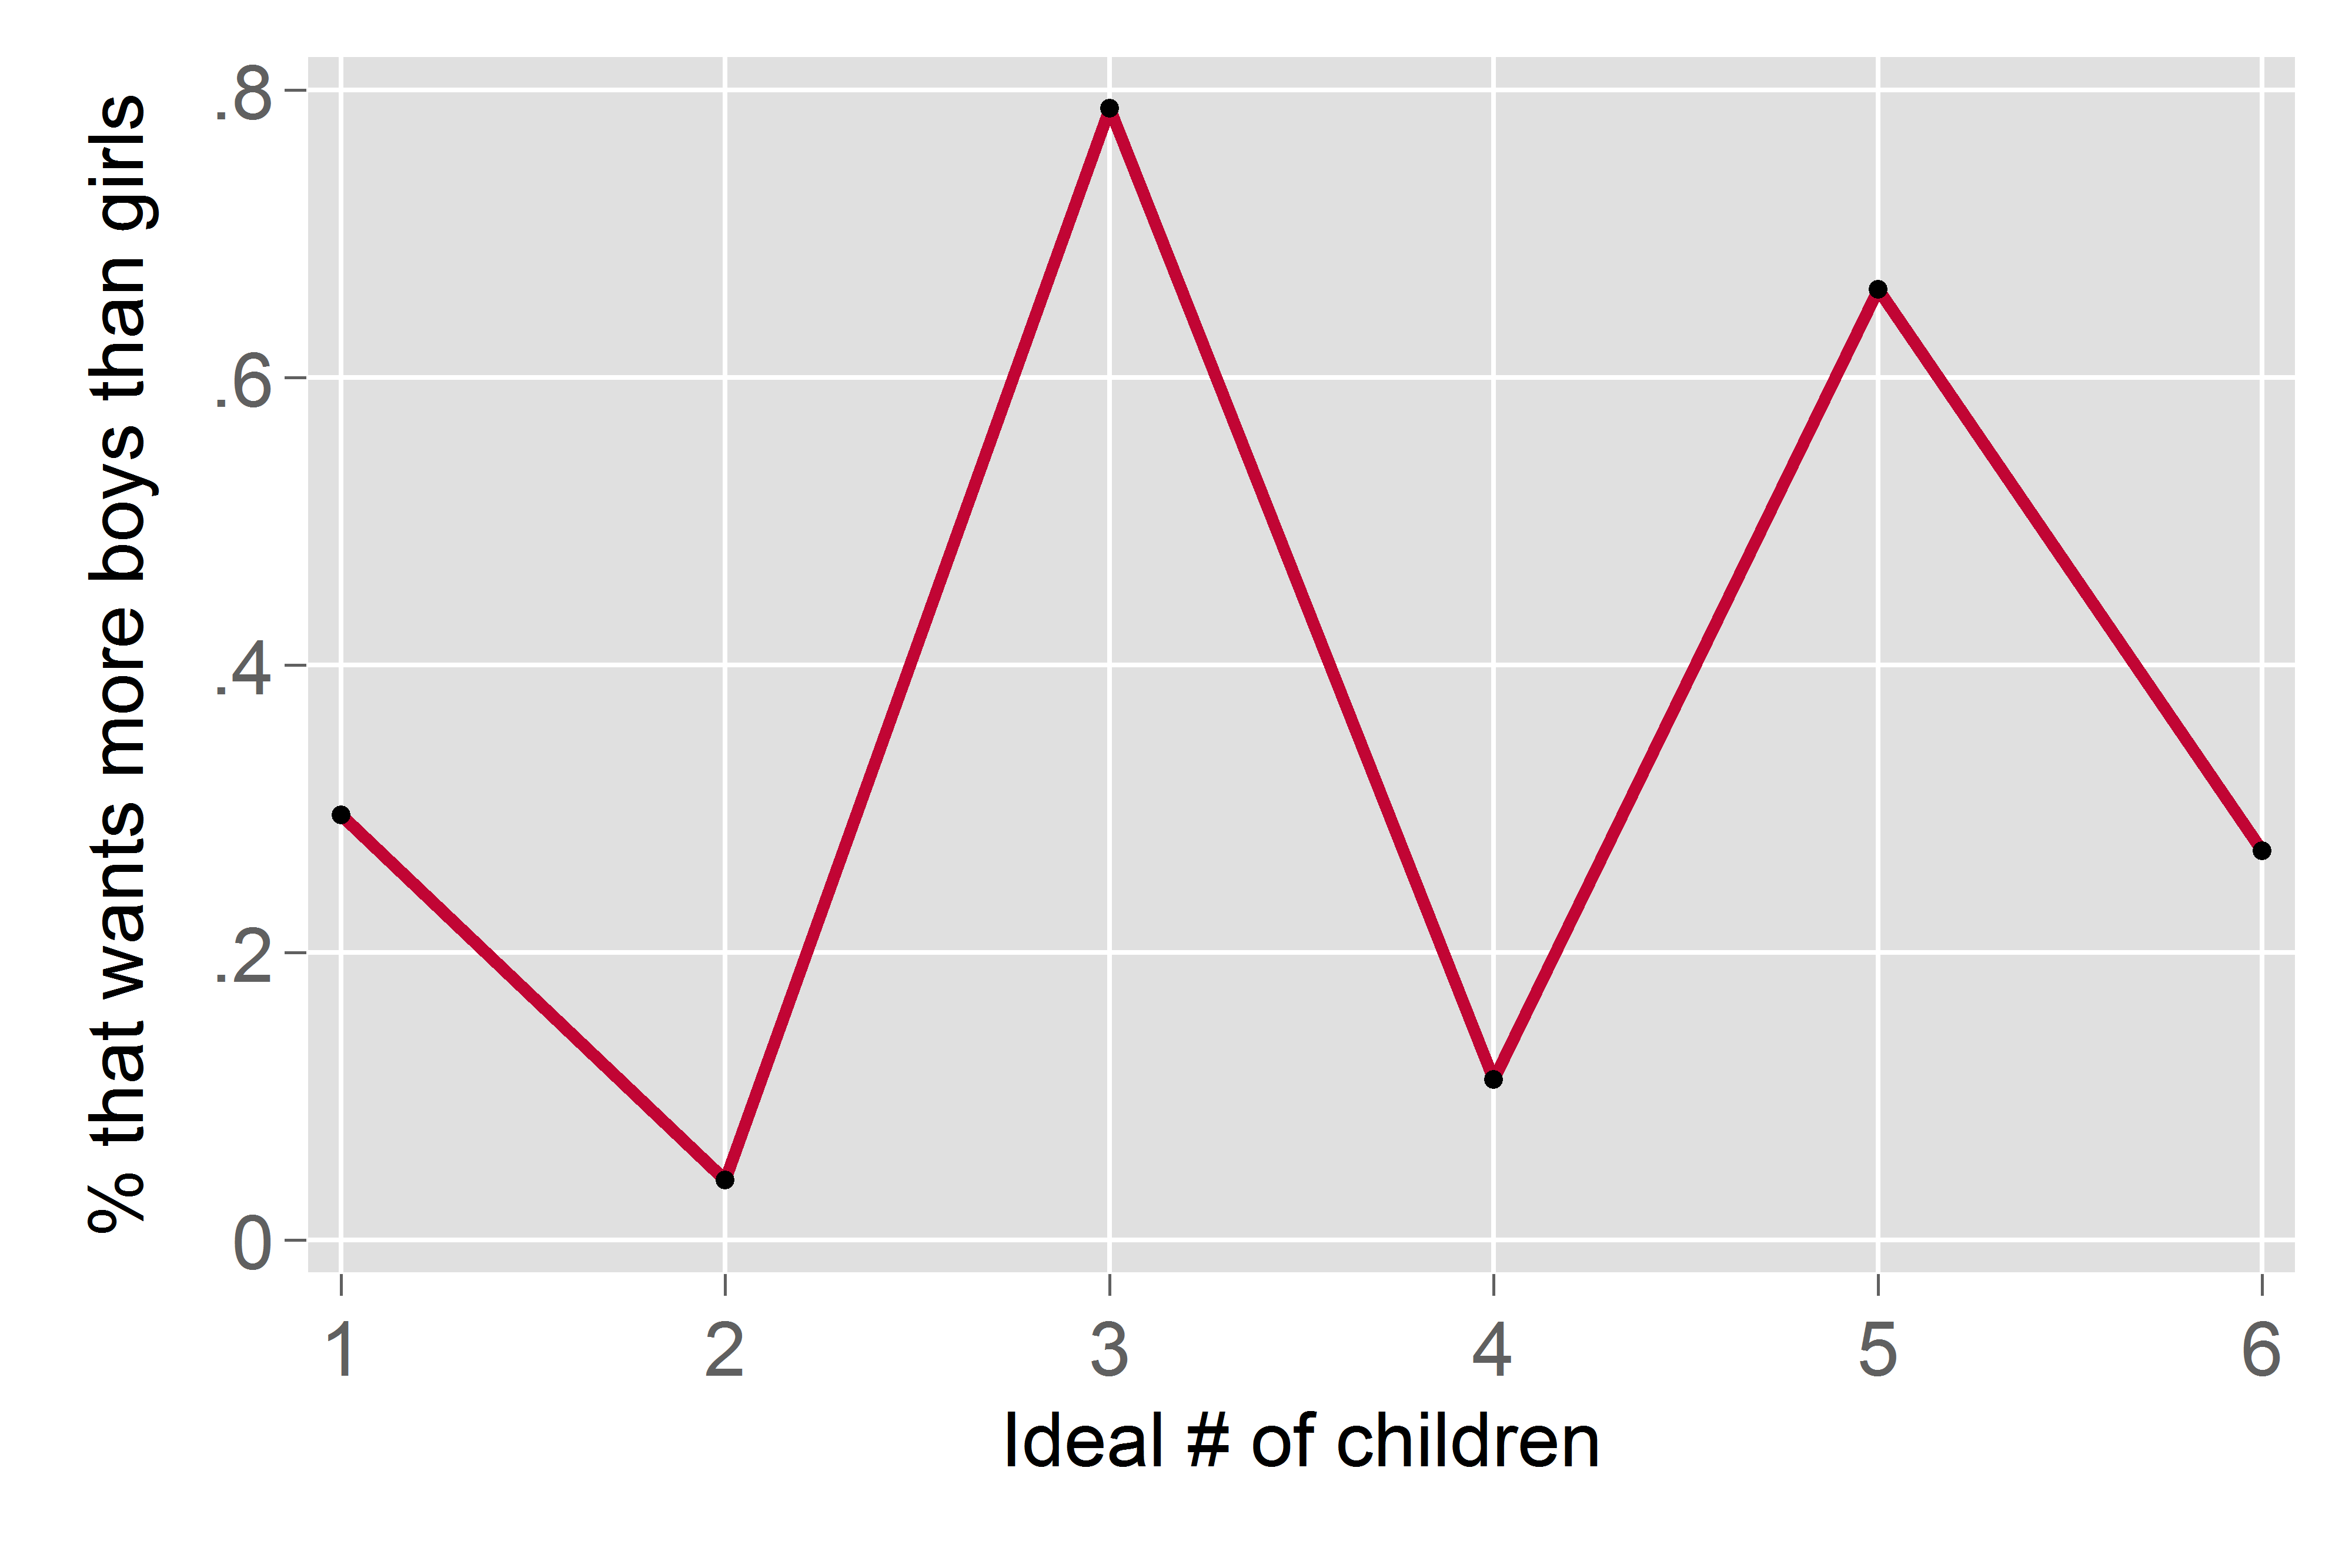
What’s going on? A first fact to know is that only a minority of respondents (19%) use the option of “would not matter if it’s a boy or a girl.” The variation in son preference mainly comes from how respondents allocate between the categories of boys and girls. (Exception: Respondents who want only 1 child are mostly indifferent about the child’s sex. For more on that separate issue that people who want smaller families tend to have less son bias, see my paper on “Fertility Decline and Missing Women.”)
A second important fact is that many people have son preference, yes, but they also like balanced sex compositions. Among those who want 2 children, the majority (78%) wants 1 boy, 1 girl. Indian women do not look so different from women anywhere in that regard. But son preference is apparent among those who want 3 children: Many more of them desire 2 boys, 1 girl (77%) than 2 girls, 1 boy (8%). Someone who wants 3 children is more likely to reveal her favoritism toward sons because she is assigning desired sex to an odd number of children. Choosing an even sex composition is impossible, so she reveals her son preference by assigning the “extra slot” to boys.
This measurement error does not get smoothed out if we aggregate, for example to the state level, because states have different fertility rates. Most respondents want either 2 (58%) or 3 children (21%). In low-fertility (rich) states, relatively more people want 2 rather than 3 children, so their measured son preference is biased downward compared to high-fertility (poor) states. The figure below shows the strong correlation between a state’s average son preference and the proportion of respondents who want an odd number of children. I highlight Punjab and Manipur because they illustrate the severity of the bias. Punjab is, by most accounts, a bastion of son preference; its sex ratio is among the most skewed in India. But with the standard son preference measure, Punjab looks better than Manipur, a Northeastern state generally viewed as having low son bias (for India!). Not coincidentally, desired fertility is lower and “less odd” in Punjab than in Manipur.
How can we improve our measure of son preference?
1. Control for desired fertility. Most simply, you can regress the “wants more boys than girls” variable on indicators for the desired number of children, and use the residual as the son preference measure. The raw son preference measure and the child sex ratio from the 2011 Census have a correlation of 0.13 across states; with the residualized measure, the correlation increases to 0.47.
2. Use revealed preference measures. You can instead use the subpopulation sex ratio, as long as having an aggregate measure suffices. Even better is the sex ratio at last birth of women with completed fertility, which picks up not only sex-selective abortions but also families continuing their childbearing until they have enough sons. Note that these measures are also entangled with desired fertility — couples that want smaller families more often “need” to use sex-selection or to exceed their desired fertility to obtain a son. Nonetheless, they are a useful complement to stated preferences.
3. Collect other stated preference data. If you are fielding your own survey, novel questions might give a better measure of son preference than the standard DHS questions. Here are two (paraphrased) questions that coauthors and I are using in an ongoing project about adolescents’ gender attitudes in Haryana, India.

- Question 1: If you were going to have 3 children, what sex composition would you want?
- Question 2: Suppose a family wants 2 children and their first 2 children are both girls [boys]. Should they (a) stop because they have reached their desired family size, or (b) have another child to try for a boy [girl]?

Join the Conversation
Kindly refer to solution 1 on "Control for desired fertility". Do we need to regress with or without the intercept?