There are multiple reasons to eat less meat and more plant-based foods – environmental, ethical, and health – and the urgency to attend to these issues grows by the day. In high-income countries (and increasingly in middle-income ones), meat products are the highest contributors to green-house gas emissions. As a development economist, who has been collecting data, mainly using face-to-face surveys, for a long-time, I am also interested in the possibilities virtual reality (VR) might offer to allow substantive enhancements to lab-in-the-field experiments. I am also weary of external validity issues that will emanate from the use of such technology, so am curious to understand whether we can gain useful knowledge from their use that can be used by policymakers IRL.
So, when I came across this paper on the effect of front-of-pack environmental labeling on food choices in the International Journal of Behavioral Nutrition and Physical Activity by Arrazat et al. (2023), I was intrigued. I was chuffed to find out that it describes a well-designed (and pre-registered) lab experiment, using VR technology, to assist the French government in its attempts to assess the feasibility of environmental labeling on food products – carried out as part of a pilot phased aimed to inform the implementation of such a labeling system in the food sector in France. This type of labeling to inform consumers about the environmental impact of their chosen food products across various food categories, if I understand correctly, would be the first time a country would institute such a system nationwide. Let me describe the study briefly and walk you through the findings of the trial before discussing some of its limitations…
Study design
The main experimental manipulation was whether there was a front-of-pack traffic-light environmental label or not. The consumers (study participants) were asked to perform two tasks: (i) create a composed meal by picking three items, or (ii) choose a ready-to-eat meal (RTE) from the shelves. To see whether the labeling had an effect above priming the consumers to prepare an environmentally-friendly meal, these two tasks were conducted twice under each experimental labeling condition: (a) make an everyday meal, or (b) make an environmentally-friendly meal. I like this scenario, as it reminds me of “meatless Mondays” and so on: if labels can help people who are already trying, that would be a plus. Details on the 66 meal components (consisting of fresh, dry, and canned foods, taken from real items in French supermarkets) and 30 RTEs can be found in the methods section of the paper. The study design is depicted in Panel A of the figure below.
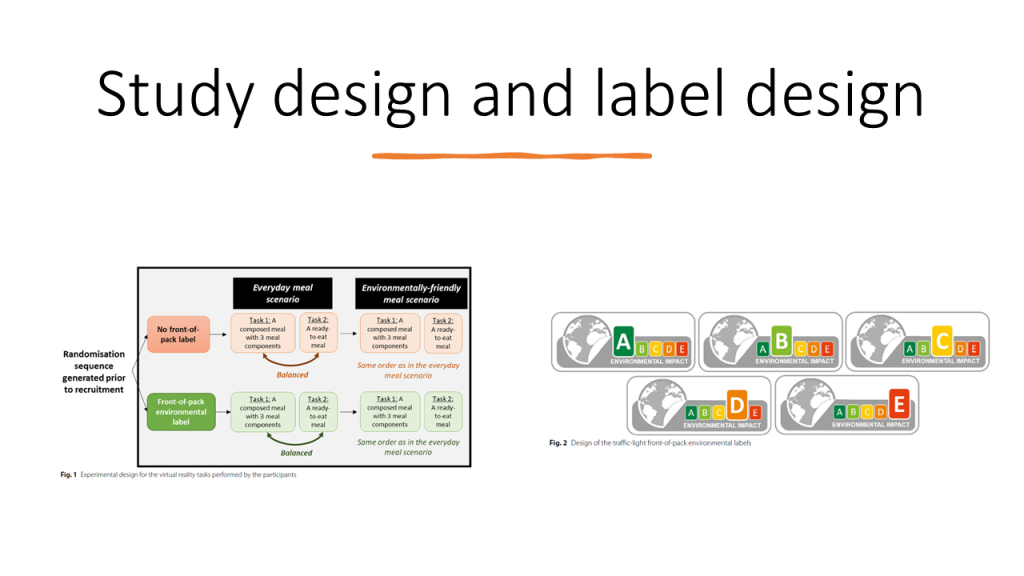
The design of the environmental label was based an ideal carbon label proposed earlier and depicted five levels of environmental impact – from A (the lowest) to E (the highest). Panel B in the figure above shows the design. These impact categories, for each of the 96 food items, were determined using the Environmental Footprint single score (EF) by retrieving these scores from the open-access Agribalyse database, which has been recommended by the European Commission for studying the environmental impact of food products and aggregates 16 indicators from life cycle analysis, such as climate change, ozone depletion, particulate matter, water use, and so on. The single scores were converted into the five categories, using quintiles of the distribution.
[EF single scores for the foods present in the Agribalyse database are expressed in mPt for 1 kg of product. Pt means “eco-indicator point” and on a scale, 1 mPt represents the mean annual environmental load of an average European inhabitant. The quintiles of these scores are presented in the supplementary appendix of the paper and I was shocked to see that some of them in the fourth and fifth quintiles, i.e., categories D & E, have scores more than one, some as high as 3-6: meaning that producing 1 KG of one of these products has the same carbon footprint of an average European for a whole year! I would have liked to know what these products are…]
The virtual supermarket environment
The study participants, who were primarily responsible for food shopping in their households and equally distributed among three age groups ranging from 18-64, were first trained in the use of the VR headsets and joysticks using fake hair-care products. Interviews afterwards suggested that people did not have trouble using the technology and were happy with the realism of the environment. The consumers could pick up an item from the shelf, examine it, and then either put it in their basket or back on the shelf. The VR technology (panel A) and the supermarket shelves (panel B) are depicted in the figure below. Sessions lasted about half an hour and participants were given 10 Euros for their participation.

The study participants were interviewed after the sessions to assess their experience with the VR technology, how realistic they found the environment, their familiarity with and liking of the products they chose, and to identify participants who were trying to guess the aim of the study (there is no detail on how this was done, and I would like to know more about this).
The outcomes considered
The primary outcome was the EF single score. The authors also assessed green-house gas emissions, ozone depletion, and particulate matter per KG of each selected product. Secondary outcomes were nutritional quality (using FSA scores developed by the British Food Standards Agency), energy cost of the items selected (more on this in the limitations discussion below). The authors also looked at the (pre-specified) meal types selected by the consumers, based on the protein source of the chosen product: meat meals (distinguished into beef/lamb vs. poultry/pork), fish meals, lacto-ovo meals (vegetarian from hereon), and plant-based meals (vegan from hereon). They are ranked in that order wrt their environmental impact (and not necessarily on their impact on animal welfare).
Findings
The main findings are in Figure 4 in the paper, reproduced below. The figure shows the EF singles scores under labeling and no labeling for two scenarios: everyday meals (Panel A) and environmentally-friendly meals (Panel B). While labeling has the effect of reducing the environmental impact of the composed meal (or the chosen RTE meal, as the effects are pooled here) in both scenarios, the effects are larger (in absolute but especially in relative terms) when people are trying to compose environmentally-friendly meals. This suggests to me that the labeling is particularly helpful for people when they are trying to do good for the environment. The more people try to do better with their diets for the environment (or the more such people try to reduce their footprint on the intensive margin), the higher might be the importance of providing them with support, such as with easy-to-understand and credible labeling of food products. With some more supporting and interesting evidence below, I have some additional (speculative) thoughts on the mechanisms…
[The authors pool the composed and RTE meals here but employ an unusual method for economists who conduct similar randomized trials: they exclude non-significant interaction terms (labeling, meal-type, and the interaction term labeling*meal-type) from regressions and estimate parameters without them (see Table S3). This causes the well-known issues of analyzing studies with factorial designs without the fully-interacted model that I discussed here – although, technically, this is not a factorial design, as the tasks are not randomized (they are contexts for heterogeneity). Nonetheless, the study is powered enough for the fully-interacted regression model, so I find this choice unnecessary: the more granular findings are useful in this experiment and I would have liked to see all eight cells in the main analysis.]

Figure 5 in the paper (reproduced in Panel A below) shows that the effect of labeling was particularly effective in the RTE meals task, moving more than half the 40% of the consumers who chose a category C or worse meal under the no label intervention into a category A or B meal. The effects, while positive, are much more muted when consumers are composing a meal by buying individual components. This suggests to me the possible importance of cognitive load when trying to be environmentally conscientious: it is easier to pick a ready-to-assemble (or frozen) meal that is category A/B than assembling one from three ingredients…It might also be that people are already self-conscious of having picked a RTE meal and don’t think that is as healthy or fresh, so they’re trying to do better in other aspects.

Figure 6 in the paper (reproduced in Panel B above) shows the effect of labeling on meal types. For RTE meals, there is no statistically significant (or substantively meaningful) effect of labeling on the choice of meal type. This is mainly because two thirds of the RTE meals chosen with no labeling are already vegetarian or vegan. Consistent with the discussion above, it seems that people find it easier to be environmentally friendly (or simply to reduce their meat consumption), by consuming ready-to-assemble meals. This might mean that many people either lack the skills or the time or both to cook satisfying dishes for their families without meat or fish: it is easier to slap a burger or steak or chicken breast on the grill or the pan and have something simple steamed on the side. The authors also point to previous research that has identified convenience, in addition to lack of knowledge, as a barrier to reducing meat consumption, suggesting training in culinary skills to accompany information interventions. It should be added that, given the impact of labeling on the environmental impact categories for RTE meals in Figure 5, Figure 6 indicates that there must have been some within category switching of food products…
Examining the composed meals in Figure 6, we see that labeling has a huge effect of switching people away from poultry/pork (my informed guess is that this is mostly poultry), with half switching to fish and half to vegetarian/vegan food items: the selection of all meat meal items declines by more than 30% from 76% to 52%. These types of switches in meal types have also implications for animal welfare, in addition to clear gains environmentally, but it is harder to state clearly whether that impact is positive or not (many chickens suffer as meat, but also as producers of eggs; some of the switching is from poultry to fish, the implications of which are also unclear wrt animal welfare).
Study limitations
To me, or more generally to an economist, the biggest issue here is that people did not use their own money (or even a voucher or a subsidy) to purchase the prescribed meals with a given budget. Nor did they get to consume the items they purchased. The most generous interpretation of the experimental design is that people were given an in-kind transfer (for choosing three items out of 66 in the composed meal task and one out of 30 in the RTE meal task). But the in-kind transfers are (endogenously) of different sizes: some are much more generous than others. The fact that the energy cost of the items produced under labeling and no labeling are not different than each other is of little solace in this respect (also, one would like to know not the per-calorie cost but the total cost here). If it were me, and I fully admit that this would be a more expensive experiment, I would have done the same VR experiment, but I would have given people a budget (fully or partially subsidized by the study) to use the VR supermarket for online shopping and I would have a supermarket deliver those items to their door. This might cost 30 Euros instead of 10 but would have the advantage of being much more realistic: now we could really see the tradeoffs people would make for meals that they would actually eat. It should be noted that the price information was removed from the images of the products in the VR supermarket, so the study participants had no idea (other than their own idiosyncratic knowledge of prices) about the price tradeoffs they were making. This is a serious shortcoming…
The authors also acknowledge that the shopping tasks excluded breakfast items, snacks, and desserts, which constitute a non-negligible share of most people’s meal planning but have much less variance in environmental impacts. So, the effects presented here could be overestimated as a result…
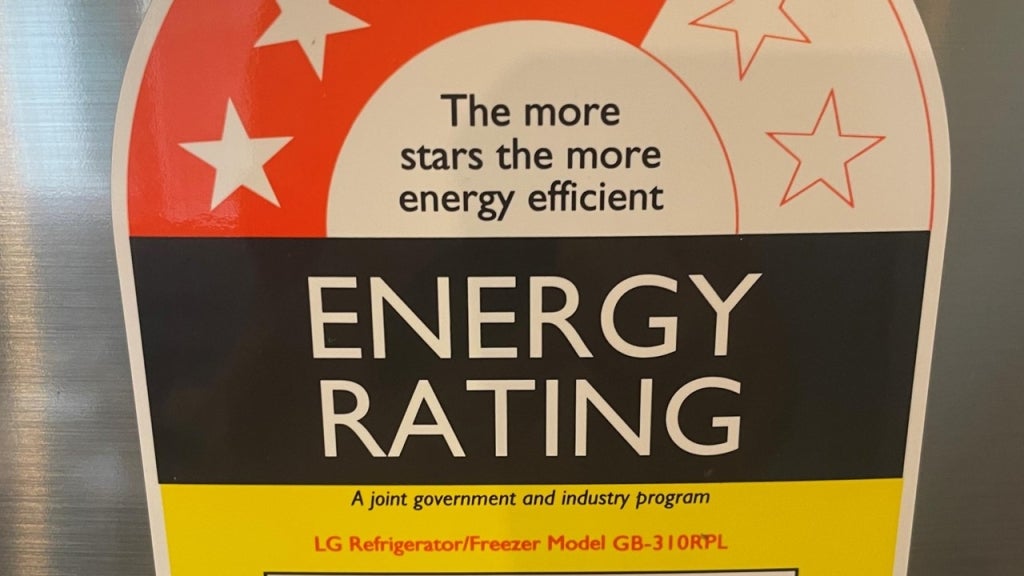
Finally, and perhaps most importantly, I’d like to discuss the feasibility of a government implementing such a system on a national scale. It is great that this study was conducted in the context of a government investigating the feasibility and efficiency of a potential labeling system. On the one hand, we did this for appliances a long time ago. Here is what the front door of my refrigerator displays:
On the other hand, I suspect that it might be much harder to implement carbon labeling of all food items. Just as the term organic became practically meaningless over time (due to compromises in definitions, as well as the difficulty of monitoring and enforcement), I worry that even if food producers agreed to a labeling convention, they would try to manipulate the system to make information fuzzier, get more favorable categorizations, and make it harder and costlier for authorities to monitor or fine them. So, even if many lessons from this study (or follow-up trials with real budgets and purchases) were incorporated into the design of a national labeling system, I am not sure that we can expect the kinds of carbon effects that are implied here.
But, overall, this is a really nice study that is carefully designed, into which a ton of careful thought seems to have gone to cross a lot of “T”s and dot a lot of “I”s. I am glad I read it and wrote a post on it, as it taught me a bunch of things I did not know, and made me think of issues I had not seriously considered. As for methods, I am sure some of you are already employing VR and similarly cutting-edge technologies for data collection, lab-in-the-field experiments, and training purposes in LMICs. If not, perhaps this post gives you some ideas going forward. In the meantime, we should all be trying our best to eat better for various reasons and development organizations should be encouraging more research along these lines.

Join the Conversation