When I start working on a new impact evaluation, I often begin with a workshop in the country where the study will be conducted. The workshop brings together government officials, both at the central level and from the regions and provinces where the intervention will take place, other stakeholders such as NGOs or other UN organizations, and representatives of the research institution that will implement the survey. Part of the workshop is devoted to teaching or refreshing memories about evaluation techniques. This usually includes a section on randomization which we try to make interactive by doing a randomization game with the participants.
Usually, we also explain the principles of blocked or stratified randomization. We need to make sure that the randomization achieves a good balance in several dimensions. We may seek a good balance in terms of geography as well as in terms of some key other characteristics. For example, for evaluating the impact of results-based financing in the health sector, we want to achieve a good balance by province or health district, but we also want to obtain a balanced distribution across different type of health facilities: rural vs. urban, hospitals vs. lower level health centers, public vs. private facilities. David and Miriam have a nice post and a paper that cover the topic. I posted earlier a video showing how we conducted such a stratified randomization during a public ceremony in Cameroon.
To explain the idea of stratified randomization, I usually compare it with the draw for the football (soccer for American readers) FIFA World Cup. This is the draw that every four year distributes the 32 qualified countries into 8 groups of 4 teams from which the 2 best teams will qualify for the next round.
In every country where I have organized impact evaluation workshops, the analogy is easy to grasp. The FIFA draw is also a public randomization, and the randomization is "guided" in order to achieve a reasonable balance in terms of continents and in terms of quality of the teams. Everywhere in the world, people understand that it is not fun to have Cameroon, Ghana, Côte d'Ivoire and Nigeria or Argentina, Ecuador, Chile and Uruguay in the same group. It is also easy for football fans to realize that having Spain, Germany, Argentina and Brazil in the same group, would make it an extremely tough competition and would guarantee that two of the best teams in the world would not play in the second phase of the World Cup.
Until recently, I thought that my World Cup analogy was bulletproof. But after seeing the results for the 2014 World Cup, I am not sure. Look at the draw for this year. The numbers in brackets are the October 2013 FIFA ranking, which were used to seed the World Cup draw.
Group B has Spain and the Netherlands, last World Cup's finalists, in the same group, together with Chile, ranked 12th. Italy, Uruguay and England, all former Word Cup winners - a while ago for the last 2 countries - are together in Group D. And the US, in Group G needs to play against Germany (three times winners), Portugal of Cristiano Ronaldo and Ghana who beat them in the second phase 4 years ago. Meanwhile, France in Group E seems to be in a relatively easier group with Switzerland, Ecuador and Honduras.
Is this the result of a bad draw that led to a relatively unbalanced distribution in terms of teams’ strength? Julien Guyon, a French mathematician thinks otherwise. In an academic paper and two blog posts, one in English and one in French, he explains that the current rules put too much emphasis on the geographic constraints and as a consequence neglect the team quality dimension.
Guyon then goes on and proposes a new method for the draw. I will not describe his method in detail as his paper and blog posts do so eloquently. His method is different from FIFA’s in this way: all the teams are seeded, according to their world ranking, 1 through 32. The teams are then assigned groups in a manner similar to other sport tournaments, like the NBA play-offs, with an attempt to group higher-rated teams with lower-rated ones. He then maintains FIFA’s geographical constraints by randomly selecting continental groupings in advance.
In his paper, he reports the result from one draw using his method.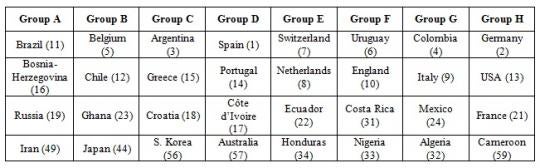
He then demonstrates, using the sums, range and standard deviation of rankings, that this draw is more balanced than the one made by the FIFA in December 2013. Most football fans will have seen this even without resorting to statistics. A post on the Upshot blog also allows the reader to simulate their own draws using the FIFA and the Guyon methods. Based on 10,000 simulations, the post also compares for each of the 32 countries participating in the World Cup the likelihood of having an easy or a strong group using either the Guyon or the FIFA methods. The variances are much lower using the Guyon method, so most countries are less likely to be drawn in a very easy group or a very hard one.
Finally, I have peppered this post with links to videos of memorable events in World Cup history. Enjoy! And if in the coming weeks you get caught by your boss or colleagues watching a game on your computer, you can always claim that you are digging into the supplementary material offered by a blog post on stratified randomization.


Join the Conversation