One of the earliest posts I wrote on this blog was about how to do power calculations with incomplete take-up. There I described the inverse-square rule for power calculations: if p is the difference in take-up rates between your treatment and control groups, then the sample size you need to attain a given power is inversely proportional to the square of p. For example, if no one takes the program in the control group, and 50% do in the treatment group, you need 1/(0.5^2) = 4 times the sample as with 100% take-up; and with 10% take-up, you would need 100 times the sample.
In revising my paper with Gabriel Lara and Claudia Ruiz on a financial education experiment with only 0.8% take-up (yes you sadly read that right, we blogged previously about why and what we did instead), the editor asks the very useful question of how this rule changes if there is treatment effect heterogeneity. The revised paper, now forthcoming at the World Bank Economic Review, explores this issue in some detail, and I thought I’d summarize some key ideas here.
Treatment Heterogeneity, Take-up, and Statistical Power
Let s be a dummy variable denoting whether or not subject i receives (takes-up) a given treatment, and gamma(i) the treatment effect of actually receiving this treatment. With treatment heterogeneity, this effect will differ across individuals, and we can assume an underlying distribution of treatment effects with some mean mu(gamma) and variance sigma(gamma) squared. Assume that no one in the control group receives the treatment. Then we show in the paper that the expected value of the standard ITT estimator takes the form:

There are two terms here, which describe how the average treatment effect changes as the take-up rate changes. The first term is the product of the take-up rate in the treatment group, and the mean treatment effect conditional on getting treated. This term falls as the take-up rate falls, making it harder to detect an effect of your intervention. If there is no treatment heterogeneity, this is the only term, and then the inverse-square rule applies.
The second term is the new part, and depends on the take-up rate, how much treatment heterogeneity there is, and the key term of the correlation between an individual’s treatment effect and their likelihood of taking the treatment. If those individuals who expect to gain more from the treatment are more likely to take it up (what Heckman et al. call essential heterogeneity), then this correlation will be positive, and the more heterogeneity there is, the stronger the effect of this second term. In contrast, in many cases individuals may have no clue as to their treatment effect (even after taking part in a program), and take-up may instead reflect a range of factors like transport distance, who program officials could reach, etc. that are not strongly correlated with treatment effects. Then this correlation may be zero, and power will be the same as in the no heterogeneity case.
What difference does this make to power? Figure 1 provides an example, calibrated to the outcome mean and sample size in our financial education experiment. With no treatment heterogeneity, or take-up uncorrelated with treatment heterogeneity, the LATE is the same regardless of the take-up rate, but power falls dramatically as take-up does – so power drops from 99.7 percent with 100 percent take-up to 64.7 percent with 50 percent take-up, and only 4.3 percent with 5 percent take-up. If, instead, people partially or fully sort into taking up treatment based on their treatment effect, then the LATE increases as the take-up rate falls (since the sample of compliers becomes those with bigger and bigger treatment effects), and power falls much less dramatically with take-up. If, we were in the extreme case where individuals perfectly order themselves into taking up the intervention by what their treatment effect would be (correlation of 1), power would only fall to 90.4 percent with 50 percent take-up, a huge gain. However, notice from the equation above that this treatment heterogeneity effect is maximized at 50% take-up, and so as take-up gets to rates of 5%, power is still really low, regardless of the correlation.
Figure 1: With Treatment Effect Heterogeneity, Power Falls Less Steeply with Take-up the More Positively Correlated Take-up is with Individual Treatment Effects

When might lower take-up increase power?
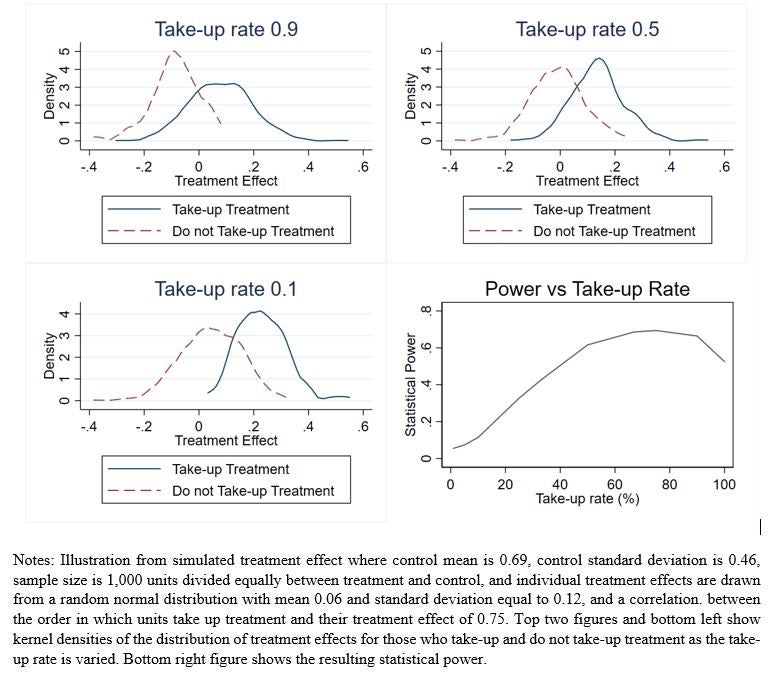
Suppose treatment heterogeneity is very large, with the program actually having negative effects for some individuals and positive effects for others. This could be the case for a vocational training program, for example, where some individuals are hurt by more time out of the labor market while training, while others gain lots of valuable skills; or perhaps in a loan program, where some take on debts they cannot manage and others use this credit to grow. Then, if take-up is strongly correlated with treatment, it can be possible for power to actually increase at first as take-up falls from 100%, since those with large negative effects no longer take-up treatment, and thus do not drag down the average. Figure 2 illustrates this case, showing the distribution of treatment effects for those who take-up and do not take-up treatment at different take-up rates (assuming a correlation of 0.75 with take-up). You can see that with a take-up rate of 90%, the 10% who do not take-up treatment are heavily drawn from those with negative treatment effects – and so by not giving them treatment, power is higher than with 100% take-up. But as the take-up rate falls, you still end up excluding many people with positive treatment effects, which causes power to then start falling.
Figure 2: In the Extreme Case, Moving from 100% Take-up to Lower Take-up Rates Can Increase Power, so Long as Take-up is not too low
What does this mean for my power calculations and for my efforts to encourage take-up?
My take-aways from this analysis are that:
1. Unless you have a program with extreme heterogeneity, that is only useful to a small subset of people and hurts almost everyone else, you should be trying to encourage take-up to at least levels of 75 or 80%.
2. If you are in a situation where people have a good idea of what the treatment is, and people can select into take-up on their anticipated treatment effect, you may not want to push too hard to boost take-up from 90% to 100%, since the power gains may be less than you think, or even negative.
3. There are some programs where we think the people that it might help best may be least likely to take it up (e.g. badly managed firms may not know they are badly managed), which would result in a negative correlation, and so pushing for higher take-up in those cases will be particularly useful.
4. When preparing power calculations, the conservative approach will be to typically apply the inverse-square rule still, but you may not lose as much power as you expect if sorting on treatment heterogeneity is possible.

Join the Conversation